Note
Click here to download the full example code
Realtime Functionality
This sample script shows how to use Tropycal to retrieve and plot real time tropical cyclones and potential formation. As this script was written on 24 September 2022, the data below is valid for the time this script was written.
from tropycal import realtime
Reading In Realtime Dataset
Let’s start with the Realtime dataset by loading it into memory. By default, this reads in Best Track data from the National Hurricane Center (NHC) and filters for all active tropical cyclones and invests over the last 18 hours.
The default is to not include global storms in the Joint Typhoon Warning Center (JTWC)’s area of responsibility. To read in invests and storms within JTWC’s domain, add a jtwc=True argument, followed by a jtwc_source argument which can be either “jtwc”, “noaa”, or “ucar”. Read through the documentation to see the limits and pros/cons of each method.
To keep this demonstration simple, we’ll solely focus on the North Atlantic basin.
Out:
--> Starting to read in current storm data
--> Completed reading in current storm data (13.45 seconds)
View Current Activity
To quickly view the content of the Realtime object, we can simply print it:
Out:
<tropycal.realtime.Realtime>
Dataset Summary:
    Numbers of active storms: 6
    Time Updated: 2106 UTC 24 September 2022

Active Storms:
    AL082022
    AL092022
    AL102022
    EP152022

Active Invests:
    AL072022
    AL992022
Alternatively, we can also list all active storms, along with an optional filter by basin.
realtime_obj.list_active_storms(basin='north_atlantic')
Out:
['AL072022', 'AL082022', 'AL092022', 'AL102022', 'AL992022']
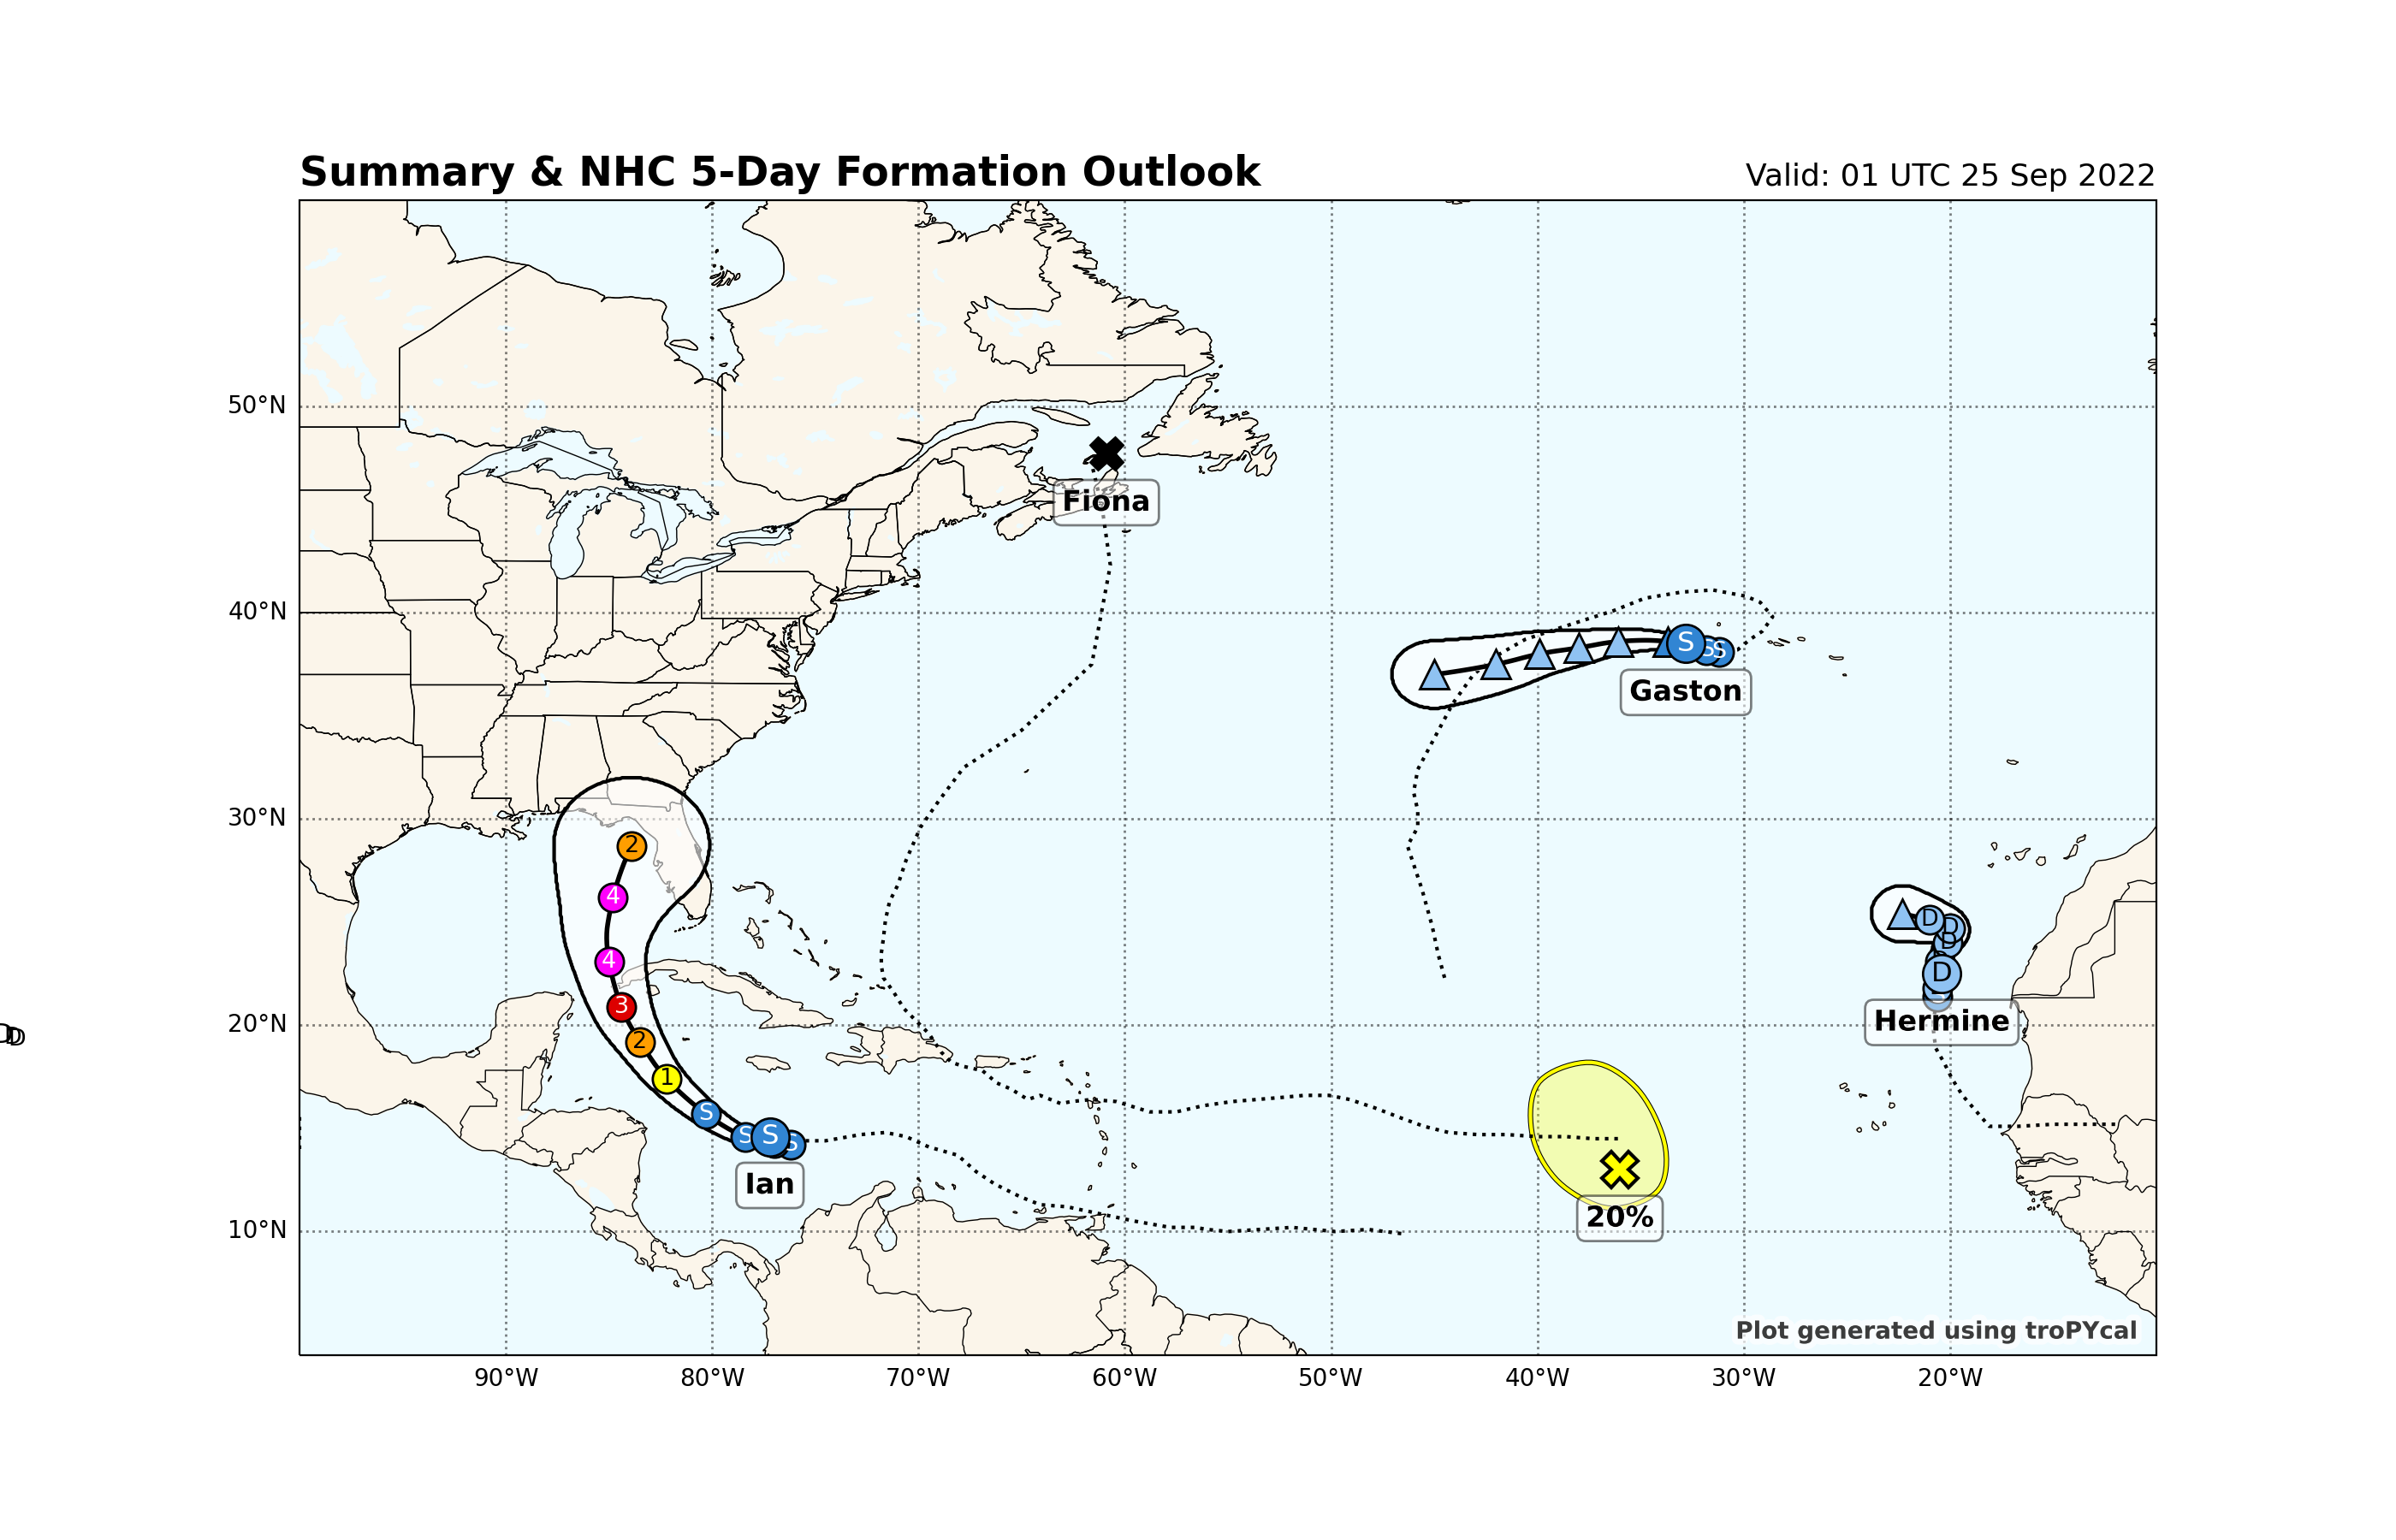
A new functionality with Tropycal v0.4 is to plot a summary of all ongoing activity, whether globally or by basin. This function can be highly customized, with more details in the documentation.
At the time this script was written, Ian, Gaston and Hermine are active in the Atlantic Ocean, with invest 99L (30% of development) active as well.
The domain option for this plot is set to ‘all’ by default, plotting the full globe. This can also be a basin (e.g., ‘north_atlantic’, ‘east_pacific’), or a custom domain, as we’ll plot below.
realtime_obj.plot_summary(domain={'w':-100,'e':-10,'s':4,'n':60})
Out:
Possible issue encountered when converting Shape #0 to GeoJSON: Shapefile format requires that polygons contain at least one exterior ring, but the Shape was entirely made up of interior holes (defined by counter-clockwise orientation in the shapefile format). The rings were still included but were encoded as GeoJSON exterior rings instead of holes.
Possible issue encountered when converting Shape #0 to GeoJSON: Shapefile format requires that polygons contain at least one exterior ring, but the Shape was entirely made up of interior holes (defined by counter-clockwise orientation in the shapefile format). The rings were still included but were encoded as GeoJSON exterior rings instead of holes.

<GeoAxesSubplot:title={'left':'Summary & NHC 5-Day Formation Outlook','right':'Valid: 01 UTC 25 Sep 2022'}>
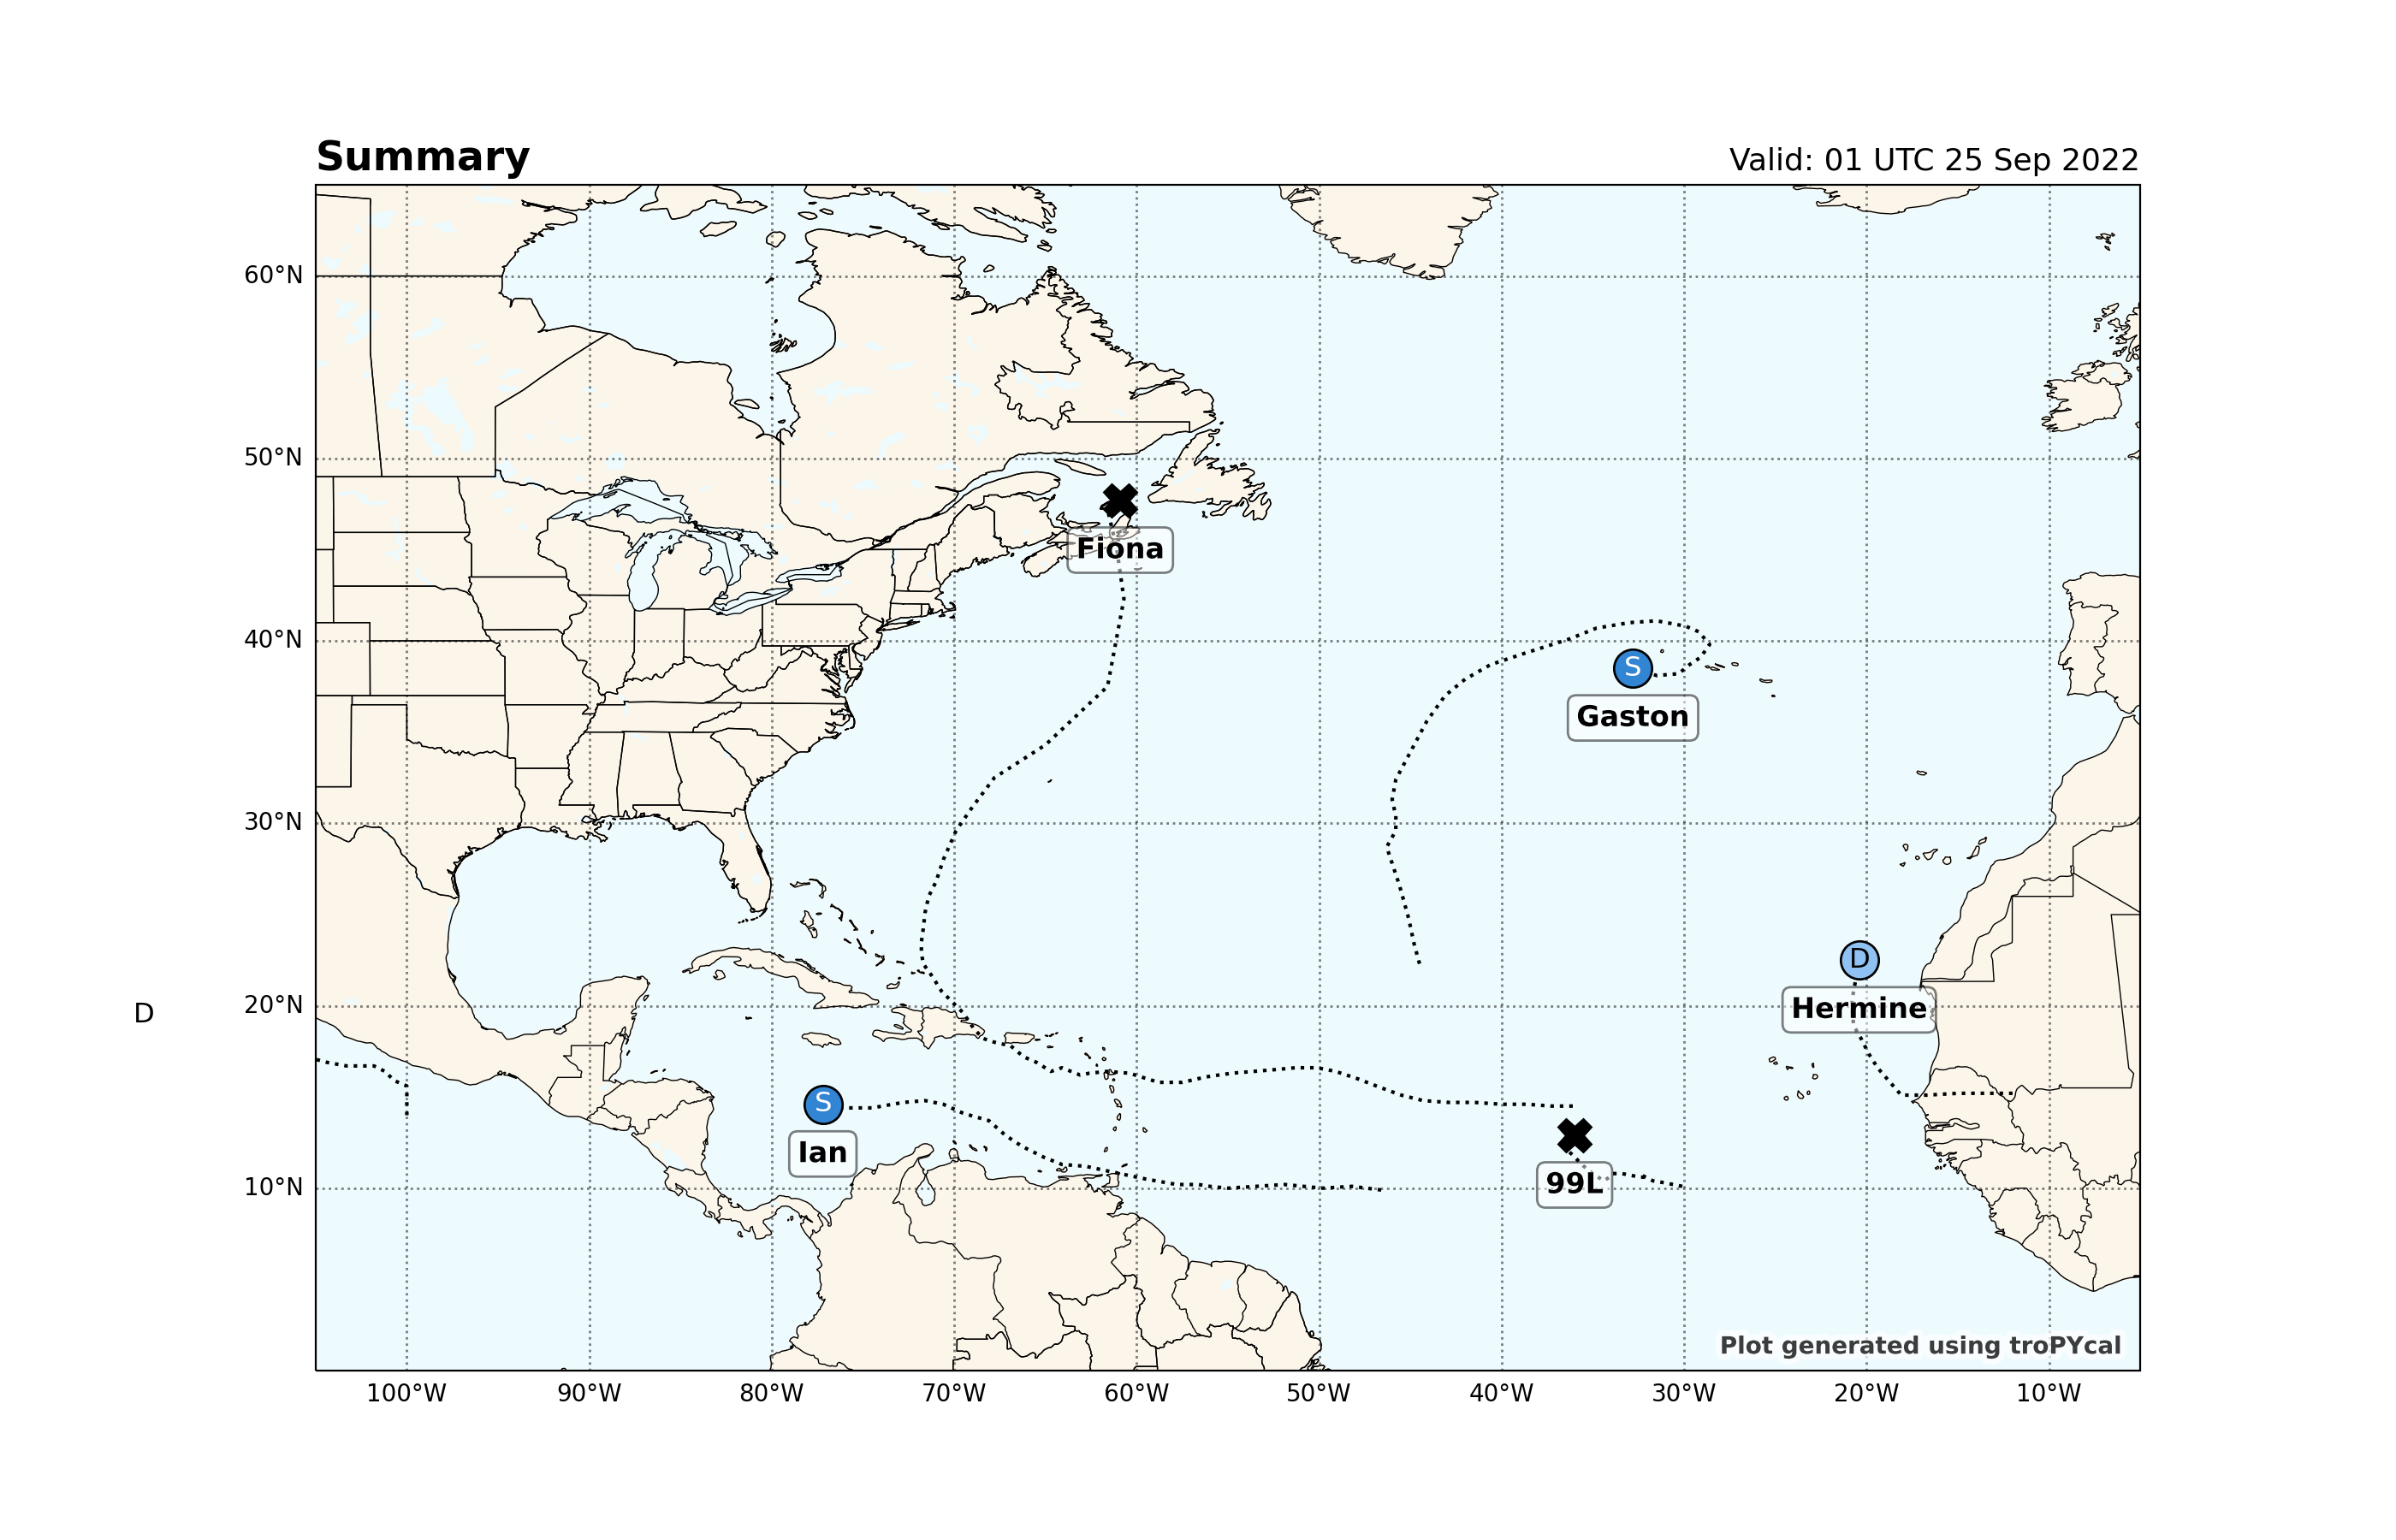
Let’s look at a few ways to customize this plot. There are four properties available to customize the plot, detailed more thoroughly in the documentation:
two_prop- Properties to customize NHC Tropical Weather Outlook (TWO) plottinginvest_prop- Properties to customize invest plottingstorm_prop- Properties to customize tropical cyclone plottingcone_prop- Properties to customize forecast cone/track plotting
The above plot includes the NHC TWO by default. Plotting the TWO overrides any invests that have a TWO associated with them (invests that are outside of NHC’s area of responsibility or don’t have a TWO still appear). We can pass the 'plot':False argument to any property dict, which in doing so removes that element from the summary map. Let’s test this out by removing the TWO and cone of uncertainty from the plot:
realtime_obj.plot_summary(domain='north_atlantic', two_prop={'plot':False}, cone_prop={'plot':False})
Out:
<GeoAxesSubplot:title={'left':'Summary','right':'Valid: 01 UTC 25 Sep 2022'}>
Realtime Storms
To retrieve a storm from a Realtime object, simply use its get_storm() method and provide an ID as listed in list_active_storms():
storm = realtime_obj.get_storm('AL092022')
This now returns a RealtimeStorm object. RealtimeStorm objects inherit the same functionality as Storm objects, but have additional functions unique to realtime storms. Additionally, as these can also be valid for invests, certain functionality that is only available for tropical cyclones (e.g., NHC forecasts or discussions) is unavailable for invests.
Let’s view what this RealtimeStorm object contains:
Out:
<tropycal.realtime.RealtimeStorm>
Storm Summary:
    Maximum Wind:      45 knots
    Minimum Pressure:  1002 hPa
    Start Date:        0600 UTC 23 September 2022
    End Date:          0000 UTC 25 September 2022

Variables:
    date        (datetime) [2022-09-19 12:00:00 .... 2022-09-25 00:00:00]
    extra_obs   (int32) [0 .... 0]
    special     (str) [ .... ]
    type        (str) [DB .... TS]
    lat         (float64) [9.9 .... 14.6]
    lon         (float64) [-46.6 .... -77.2]
    vmax        (int32) [20 .... 45]
    mslp        (int32) [1012 .... 1002]
    wmo_basin   (str) [north_atlantic .... north_atlantic]

More Information:
    id:              AL092022
    operational_id:  AL092022
    name:            IAN
    year:            2022
    season:          2022
    basin:           north_atlantic
    source_info:     NHC Hurricane Database
    invest:          False
    source_method:   NHC's Automated Tropical Cyclone Forecasting System (ATCF)
    source_url:      https://ftp.nhc.noaa.gov/atcf/btk/
    source:          hurdat
    jtwc_source:     N/A
    ace:             0.8
    prob_2day:       N/A
    prob_5day:       N/A
    risk_2day:       N/A
    risk_5day:       N/A
    realtime:        True
A quick and easy way to check if a storm is an invest is by checking its invest attribute. This will let you know if you can use the full set of functionality available for tropical cyclones or not.
Out:
False
The next few blocks will overview functions unique to RealtimeStorm objects. We can easily retrieve the latest available forecast dictionary from NHC or JTWC, depending on what area of responsibility the storm is in.
This function also calculates the forecast Accumulated Cyclone Energy (ACE), derived by combining its observed ACE through the current time plus the forecast ACE using linearly interpolated forecast sustained wind.
Out:
{'init': datetime.datetime(2022, 9, 24, 18, 0), 'fhr': [0, 3, 12, 24, 36, 48, 60, 72, 96, 120], 'lat': [14.2, 14.3, 14.6, 15.7, 17.4, 19.2, 20.9, 23.1, 26.2, 28.7], 'lon': [-76.2, -77.0, -78.4, -80.3, -82.2, -83.5, -84.4, -85.0, -84.8, -83.9], 'vmax': [40, 40, 50, 60, 75, 95, 110, 115, 115, 90], 'mslp': [nan, 1003, nan, nan, nan, nan, nan, nan, nan, nan], 'type': ['TS', 'TS', 'TS', 'TS', 'HU', 'HU', 'HU', 'HU', 'HU', 'HU'], 'windrad': [{34: [0, 0, 0, 50]}, {34: [0, 0, 0, 50]}, {34: [40, 30, 0, 50]}, {34: [70, 50, 30, 60], 50: [30, 0, 0, 0]}, {34: [100, 70, 50, 90], 50: [40, 30, 20, 30], 64: [20, 15, 0, 15]}, {34: [110, 100, 70, 100], 50: [50, 40, 30, 40], 64: [25, 20, 20, 20]}, {34: [120, 110, 90, 110], 50: [60, 60, 50, 60]}, {34: [130, 120, 100, 120], 50: [70, 70, 50, 60]}, {34: [0, 0, 0, 0], 50: [0, 0, 0, 0]}, {34: [0, 0, 0, 0], 50: [0, 0, 0, 0]}], 'cumulative_ace': [0.6, 1.0, 1.7, 2.7, 4.3, 6.6, 9.2, 14.4, 18.4], 'cumulative_ace_fhr': [0, 12, 24, 36, 48, 60, 72, 96, 120]}
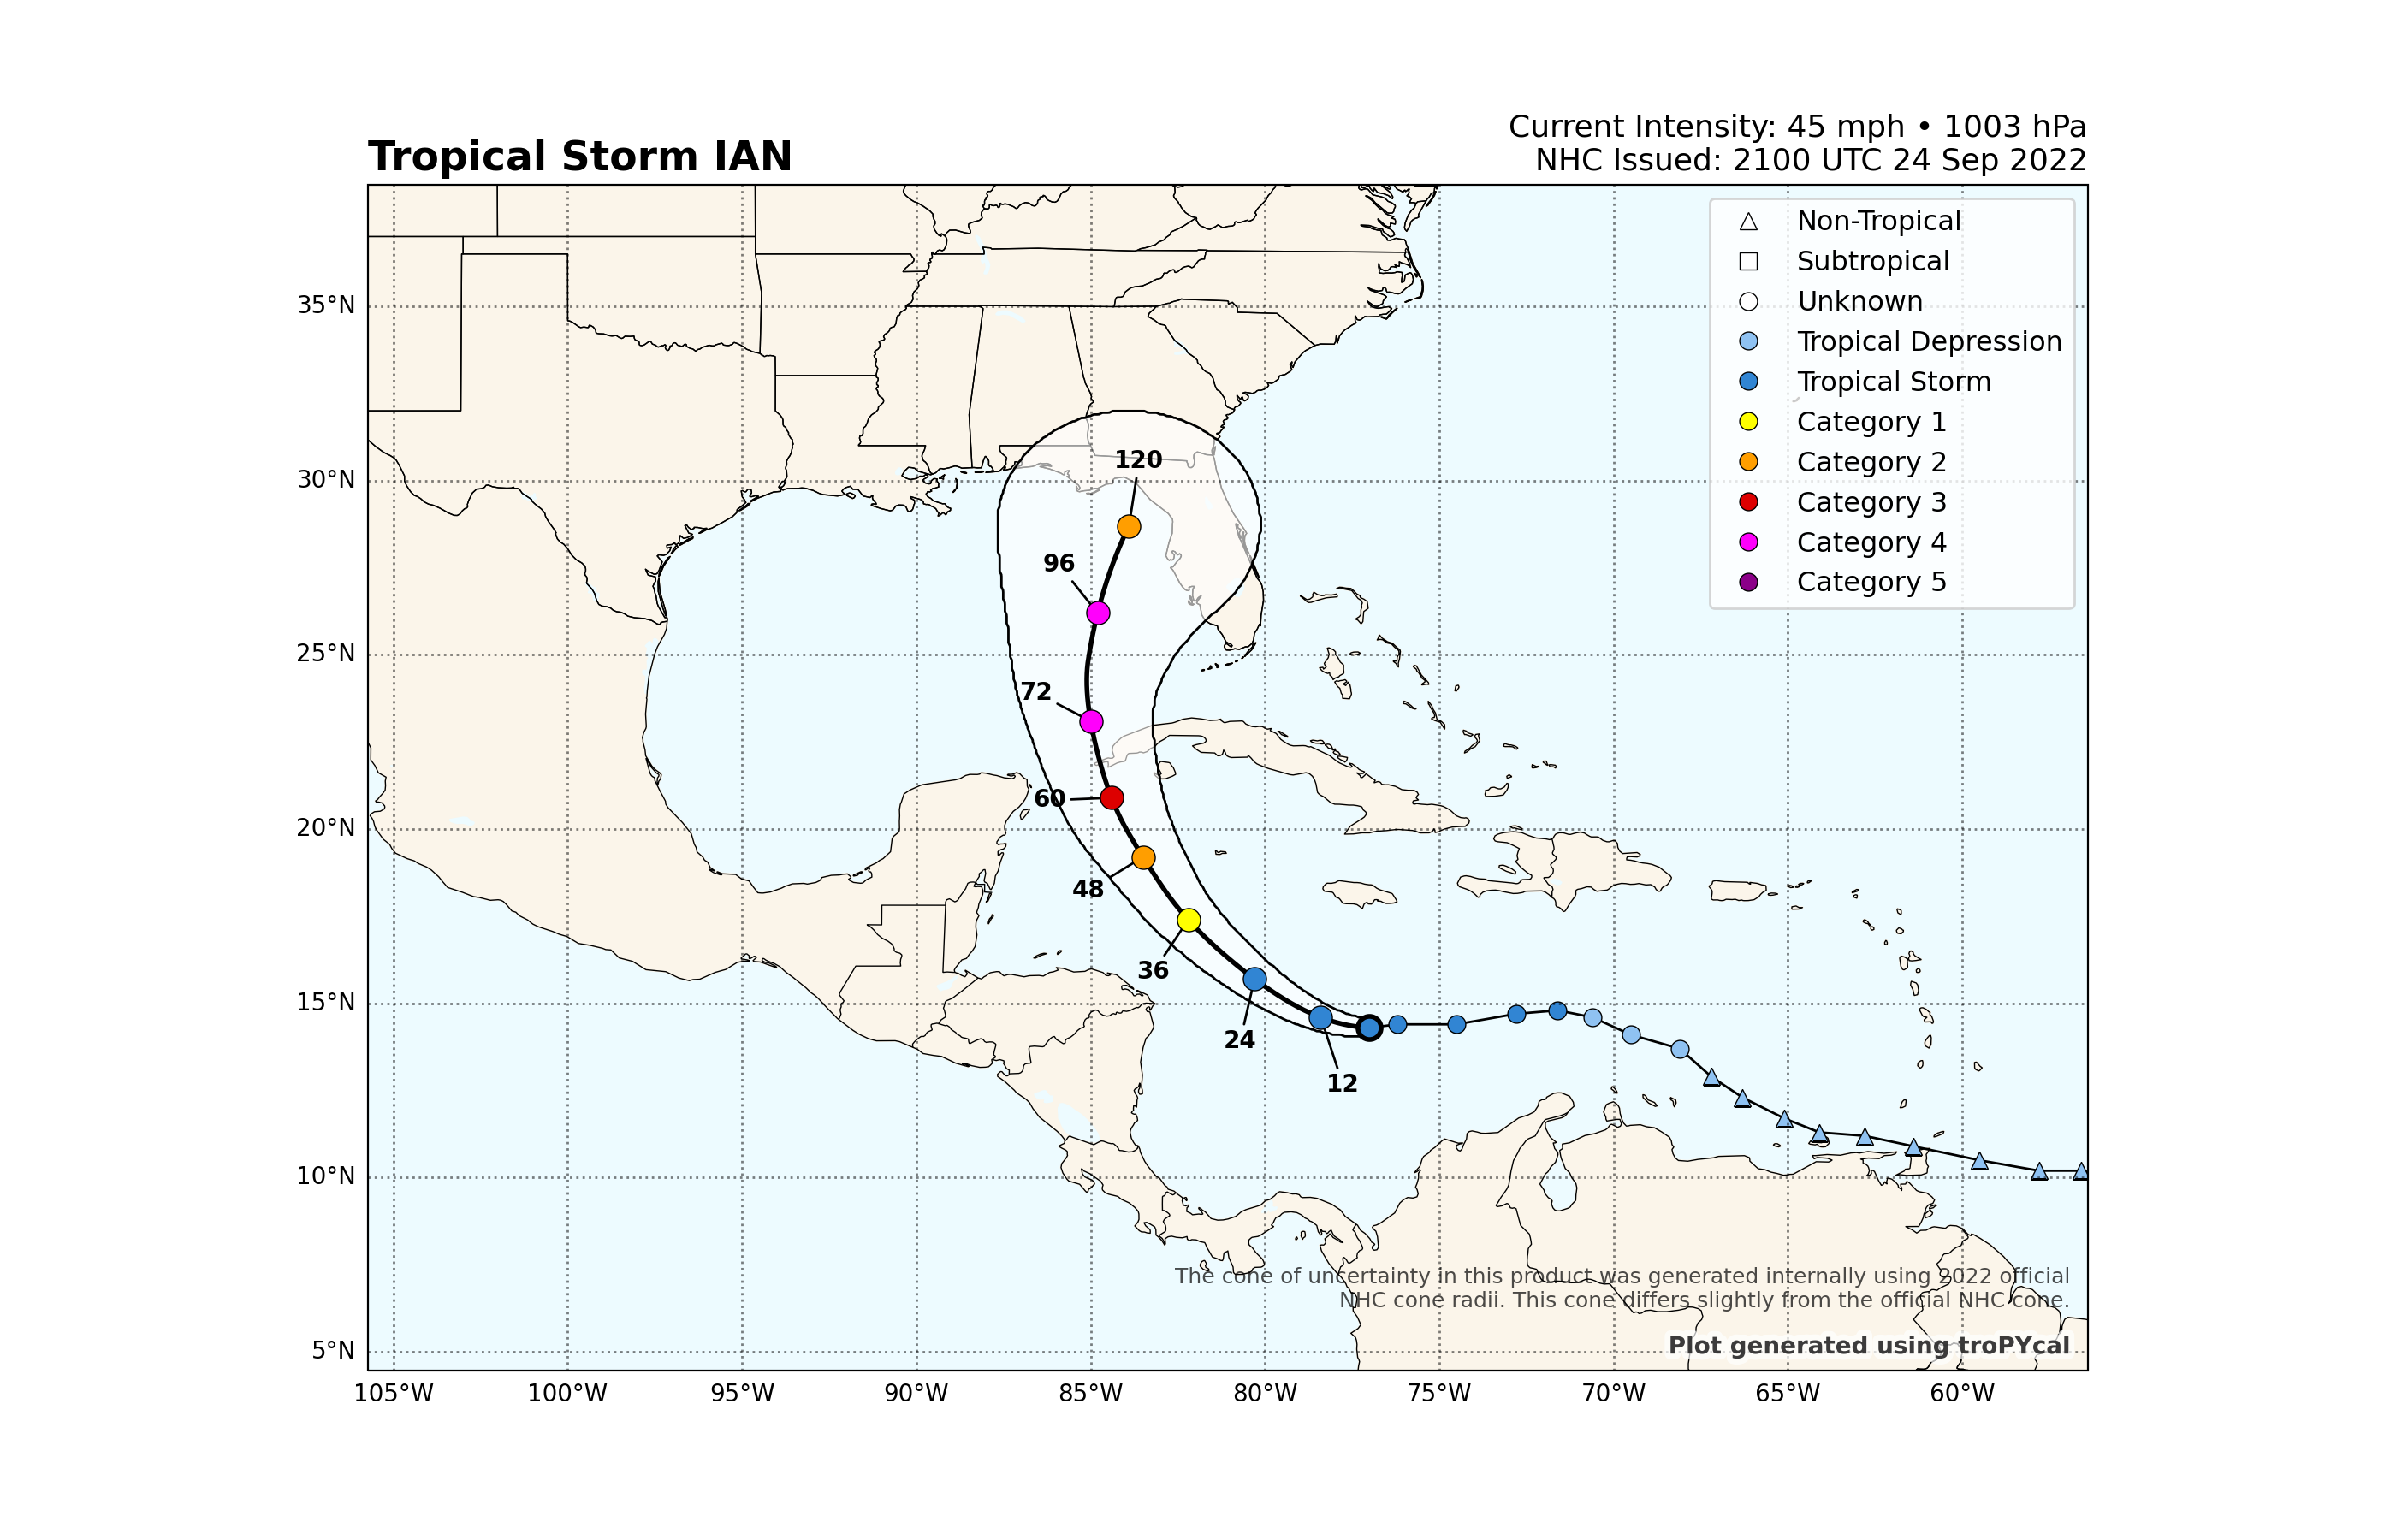
We can also plot it using the plot_forecast_realtime() method:
Out:
<GeoAxesSubplot:title={'left':'Tropical Storm IAN','right':'Current Intensity: 45 mph • 1003 hPa\nNHC Issued: 2100 UTC 24 Sep 2022'}>
Storm forecast discussions can also be retrieved for storms in NHC’s area of responsibility, or the Prognostic Reasoning product for JTWC’s area of responsibility.
Out:
{'id': 7, 'time_issued': datetime.datetime(2022, 9, 24, 21, 0), 'text': 'ZCZC MIATCDAT4 ALL\nTTAA00 KNHC DDHHMM\n \nTropical Storm Ian Discussion Number 7\nNWS National Hurricane Center Miami FL AL092022\n500 PM EDT Sat Sep 24 2022\n \nThe satellite presentation of Ian has improved this afternoon. The\nassociated deep convection shows increased signs of organization,\nand the deep-layer shear appears to have diminished over the cyclone\nbased on more extensive upper-level outflow noted in visible\nsatellite imagery. An Air Force Hurricane Hunter aircraft found\n850-mb peak flight level winds of 44 kt and several SFMR retrievals\ngreater than 40 kt, while dropsonde data suggest the minimum\npressure has not changed much since the previous flight. A blend of\nthese data support an initial intensity of 40 kt for this advisory.\n \nThe aircraft data suggest the center could be re-forming slightly\nwest of previous estimates, so the initial motion is an uncertain\n265/14 kt. Ian is expected to move westward through early Sunday\nbefore turning northwestward around the southwestern periphery of a\nridge to the north. A north-northwestward to northward motion is\nforecast on Monday and Tuesday as the center of Ian passes near or\nover the western tip of Cuba and emerges over the southeastern Gulf\nof Mexico. Overall, the westward trend in the track models\ncontinues, with the latest GFS on the far left side of the guidance\nenvelope and the ECMWF on the right edge. The track forecast is\nstill highly uncertain at days 4-5, with the GFS and ECMWF positions\nabout 200 n mi apart by 96 h. There is significant spread noted even\namong the GFS ensemble members, with positions that range from the\nnorth-central Gulf of Mexico to the west coast of Florida.\nHopefully, data collected from special radiosonde releases and a\nNOAA G-IV flight this evening will help better resolve the steering\nflow around Ian and the deep-layer trough that is forecast to be\nover the eastern U.S. early next week. The latest NHC track forecast\nis once again adjusted westward, and further adjustments may be\nneeded given the increased uncertainty in the day 3-5 period.\n \nIan is expected to significantly strengthen over the next few\ndays as it moves within a low shear environment over SSTs greater\nthan 30 deg C in the northwestern Caribbean Sea. As the structure\nof the cyclone continues to improve and Ian develops an inner core,\nrapid intensification (RI) appears very likely. The SHIPS-RII\nprobabilities continue to highlight this potential, with a 66\npercent chance of a 65-kt intensity increase in 72 h. The NHC\nintensity forecast has been raised substantially through 96 h, and\nit now shows Ian reaching major hurricane strength by late Monday\nbefore it nears western Cuba. These changes closely follow the IVCN\nand HCCA consensus aids, although there remains guidance even higher\nthan the current forecast. Ian is forecast to remain a major\nhurricane as it moves northward across the eastern Gulf of Mexico\nand approaches Florida. Environmental conditions could become less\nfavorable late in the period due to southerly shear associated with\nthe aforementioned trough, but Ian is expected to remain a large\nand powerful hurricane through the period.\n \n \nKey Messages:\n \n1. Ian is expected to produce heavy rainfall, flash flooding, and\npossible mudslides in areas of higher terrain, particularly over\nJamaica and Cuba. Limited flash and urban flooding is possible with\nrainfall across the Florida Keys and Florida peninsula through mid\nnext week.\n \n2. Hurricane or tropical storm conditions are expected on Grand\nCayman beginning early Monday.\n \n3. Ian is forecast to be a major hurricane when it passes near or\nover western Cuba, and there is increasing confidence in a\nlife-threatening storm surge and hurricane-force winds in portions\nof western Cuba beginning late Monday.\n \n4. Ian is expected to remain a major hurricane when it moves\ngenerally northward across the eastern Gulf of Mexico during the\nmiddle of next week, but uncertainty in the track forecast is higher\nthan usual. Regardless of Ian’s exact track, there is a risk of\ndangerous storm surge, hurricane-force winds, and heavy rainfall\nalong the west coast of Florida and the Florida Panhandle by the\nmiddle of next week, and residents in Florida should ensure they\nhave their hurricane plan in place, follow any advice given by local\nofficials, and closely monitor updates to the forecast.\n \n \nFORECAST POSITIONS AND MAX WINDS\n \nINIT 24/2100Z 14.3N 77.0W 40 KT 45 MPH\n 12H 25/0600Z 14.6N 78.4W 50 KT 60 MPH\n 24H 25/1800Z 15.7N 80.3W 60 KT 70 MPH\n 36H 26/0600Z 17.4N 82.2W 75 KT 85 MPH\n 48H 26/1800Z 19.2N 83.5W 95 KT 110 MPH\n 60H 27/0600Z 20.9N 84.4W 110 KT 125 MPH\n 72H 27/1800Z 23.1N 85.0W 115 KT 130 MPH\n 96H 28/1800Z 26.2N 84.8W 115 KT 130 MPH\n120H 29/1800Z 28.7N 83.9W 90 KT 105 MPH\n \n$$\nForecaster Reinhart\n \nNNNN\n'}
Lastly, RealtimeStorms also provide the latest available information using the get_realtime_info() method.
The default argument is source='all', which returns the latest available data whether from Best Track or NHC Public Advisories. Other possible values are “public_advisory”, which only returns the latest public advisory, or “best_track”, which only returns the latest best track data.
Out:
{'source': 'NHC Public Advisory', 'advisory_number': '7A', 'time_utc': datetime.datetime(2022, 9, 25, 0, 0), 'type': 'Tropical Storm', 'name': 'Ian', 'lat': 14.6, 'lon': -77.1, 'wind_mph': 45, 'wind_kph': 75, 'wind_kt': 40, 'mslp': 1002, 'category': 0, 'motion_direction': 'W', 'motion_direction_degrees': 275, 'motion_mph': 14, 'motion_kph': 22, 'motion_kt': 12}
Realtime Invests
Invests are essentially RealtimeStorm objects, but without much of the functionality that comes with tropical cyclones (e.g., official forecast track, forecast discussion, etc.). Let’s test this out for invest 99L:
invest = realtime_obj.get_storm('AL992022')
invest
Out:
<tropycal.realtime.RealtimeStorm>
Storm Summary:
    Maximum Wind:      25 knots
    Minimum Pressure:  1009 hPa
    Start Date:        1200 UTC 20 September 2022
    End Date:          0000 UTC 25 September 2022

Variables:
    date        (datetime) [2022-09-20 12:00:00 .... 2022-09-25 00:00:00]
    extra_obs   (int32) [0 .... 0]
    special     (str) [ .... ]
    type        (str) [DB .... LO]
    lat         (float64) [10.1 .... 12.9]
    lon         (float64) [-30.1 .... -36.0]
    vmax        (int32) [20 .... 25]
    mslp        (int32) [1010 .... 1009]
    wmo_basin   (str) [north_atlantic .... north_atlantic]

More Information:
    id:              AL992022
    operational_id:  AL992022
    name:            99L
    year:            2022
    season:          2022
    basin:           north_atlantic
    source_info:     NHC Hurricane Database
    invest:          True
    source_method:   NHC's Automated Tropical Cyclone Forecasting System (ATCF)
    source_url:      https://ftp.nhc.noaa.gov/atcf/btk/
    source:          hurdat
    jtwc_source:     N/A
    ace:             0.0
    prob_2day:       10%
    prob_5day:       20%
    risk_2day:       Low
    risk_5day:       Low
    realtime:        True
As we can see above, the invest attribute of this object is True. For invests in NHC’s area of responsibility, we can retrieve NHC’s probability of formation which is matched to the closest TWO to the invest within a certain distance of the invest.
Out:
{'prob_2day': '10%', 'risk_2day': 'Low', 'prob_5day': '20%', 'risk_5day': 'Low'}
Total running time of the script: ( 0 minutes 48.238 seconds)