Note
Go to the end to download the full example code
Individual Storm Analysis
This sample script illustrates how to retrieve a single storm from the HURDAT2 dataset, and make plots and analyses of this storm.
import tropycal.tracks as tracks
import datetime as dt
HURTDAT2 Dataset
Let’s start by creating an instance of a TrackDataset object. By default, this reads in the HURDAT2 dataset from the National Hurricane Center (NHC) website. For this example we’ll be using the HURDAT2 dataset over the North Atlantic basin.
HURDAT data is not available for the most recent hurricane seasons. To include the latest data up through today, the “include_btk” flag would need to be set to True, which reads in preliminary best track data from the NHC website.
basin = tracks.TrackDataset(basin='north_atlantic',source='hurdat',include_btk=False)
--> Starting to read in HURDAT2 data
--> Completed reading in HURDAT2 data (2.36 seconds)
Individual storm analysis
Individual storms can be retrieved from the dataset by calling the get_storm() function, which returns an instance of a Storm object. This can be done by either entering a tuple containing the storm name and year, or by the standard tropical cyclone ID (e.g., “AL012019”).
Let’s retrieve an instance of Hurricane Michael from 2018:
storm = basin.get_storm(('michael',2018))
We can quickly visualize what the Storm object contains by printing it:
print(storm)
<tropycal.tracks.Storm>
Storm Summary:
    Maximum Wind:      140 knots
    Minimum Pressure:  919 hPa
    Start Time:        0600 UTC 07 October 2018
    End Time:          1800 UTC 11 October 2018

Variables:
    time        (datetime) [2018-10-06 18:00:00 .... 2018-10-15 18:00:00]
    extra_obs   (int64) [0 .... 0]
    special     (str) [ .... ]
    type        (str) [LO .... EX]
    lat         (float64) [17.8 .... 41.2]
    lon         (float64) [-86.6 .... -10.0]
    vmax        (int64) [25 .... 35]
    mslp        (int64) [1006 .... 1001]
    wmo_basin   (str) [north_atlantic .... north_atlantic]

More Information:
    id:              AL142018
    operational_id:  AL142018
    name:            MICHAEL
    year:            2018
    season:          2018
    basin:           north_atlantic
    source_info:     NHC Hurricane Database
    source:          hurdat
    ace:             12.5
    realtime:        False
    invest:          False
This instance of Storm contains several methods that return the storm data back in different data types. The following examples will show # how to retrieve 3 different data types.
Retrieve a dictionary of Michael’s data:
print(storm.to_dict())
{'id': 'AL142018', 'operational_id': 'AL142018', 'name': 'MICHAEL', 'year': 2018, 'season': 2018, 'basin': 'north_atlantic', 'source_info': 'NHC Hurricane Database', 'source': 'hurdat', 'time': [datetime.datetime(2018, 10, 6, 18, 0), datetime.datetime(2018, 10, 7, 0, 0), datetime.datetime(2018, 10, 7, 6, 0), datetime.datetime(2018, 10, 7, 12, 0), datetime.datetime(2018, 10, 7, 18, 0), datetime.datetime(2018, 10, 8, 0, 0), datetime.datetime(2018, 10, 8, 6, 0), datetime.datetime(2018, 10, 8, 12, 0), datetime.datetime(2018, 10, 8, 18, 0), datetime.datetime(2018, 10, 9, 0, 0), datetime.datetime(2018, 10, 9, 6, 0), datetime.datetime(2018, 10, 9, 12, 0), datetime.datetime(2018, 10, 9, 18, 0), datetime.datetime(2018, 10, 10, 0, 0), datetime.datetime(2018, 10, 10, 6, 0), datetime.datetime(2018, 10, 10, 12, 0), datetime.datetime(2018, 10, 10, 17, 30), datetime.datetime(2018, 10, 10, 18, 0), datetime.datetime(2018, 10, 11, 0, 0), datetime.datetime(2018, 10, 11, 6, 0), datetime.datetime(2018, 10, 11, 12, 0), datetime.datetime(2018, 10, 11, 18, 0), datetime.datetime(2018, 10, 12, 0, 0), datetime.datetime(2018, 10, 12, 6, 0), datetime.datetime(2018, 10, 12, 12, 0), datetime.datetime(2018, 10, 12, 18, 0), datetime.datetime(2018, 10, 13, 0, 0), datetime.datetime(2018, 10, 13, 6, 0), datetime.datetime(2018, 10, 13, 12, 0), datetime.datetime(2018, 10, 13, 18, 0), datetime.datetime(2018, 10, 14, 0, 0), datetime.datetime(2018, 10, 14, 6, 0), datetime.datetime(2018, 10, 14, 12, 0), datetime.datetime(2018, 10, 14, 18, 0), datetime.datetime(2018, 10, 15, 0, 0), datetime.datetime(2018, 10, 15, 6, 0), datetime.datetime(2018, 10, 15, 12, 0), datetime.datetime(2018, 10, 15, 18, 0)], 'extra_obs': [0, 0, 0, 0, 0, 0, 0, 0, 0, 0, 0, 0, 0, 0, 0, 0, 1, 0, 0, 0, 0, 0, 0, 0, 0, 0, 0, 0, 0, 0, 0, 0, 0, 0, 0, 0, 0, 0], 'special': ['', '', '', '', '', '', '', '', '', '', '', '', '', '', '', '', 'L', '', '', '', '', '', '', '', '', '', '', '', '', '', '', '', '', '', '', '', '', ''], 'type': ['LO', 'LO', 'TD', 'TS', 'TS', 'TS', 'TS', 'HU', 'HU', 'HU', 'HU', 'HU', 'HU', 'HU', 'HU', 'HU', 'HU', 'HU', 'HU', 'TS', 'TS', 'TS', 'EX', 'EX', 'EX', 'EX', 'EX', 'EX', 'EX', 'EX', 'EX', 'EX', 'EX', 'EX', 'EX', 'EX', 'EX', 'EX'], 'lat': [17.8, 18.1, 18.4, 18.8, 19.1, 19.7, 20.2, 20.9, 21.7, 22.7, 23.7, 24.6, 25.6, 26.6, 27.7, 29.0, 30.0, 30.2, 31.5, 32.8, 34.1, 35.6, 36.5, 37.3, 39.1, 41.1, 43.1, 44.8, 46.4, 47.6, 48.4, 48.8, 48.6, 47.5, 45.9, 44.4, 42.8, 41.2], 'lon': [-86.6, -86.9, -86.8, -86.4, -85.7, -85.5, -85.4, -85.1, -85.1, -85.2, -85.8, -86.2, -86.4, -86.5, -86.6, -86.3, -85.5, -85.4, -84.5, -83.2, -81.7, -80.0, -77.7, -75.0, -70.6, -66.1, -61.5, -55.7, -48.2, -40.7, -33.1, -26.1, -20.7, -16.4, -13.5, -11.4, -10.3, -10.0], 'vmax': [25, 25, 30, 35, 45, 50, 60, 65, 75, 85, 85, 90, 100, 110, 120, 125, 140, 135, 80, 50, 45, 45, 50, 60, 60, 60, 65, 65, 65, 65, 65, 65, 60, 55, 55, 50, 35, 35], 'mslp': [1006, 1004, 1004, 1003, 999, 996, 984, 982, 977, 971, 973, 968, 961, 952, 945, 934, 919, 920, 957, 979, 987, 991, 988, 983, 980, 977, 975, 975, 975, 975, 975, 975, 975, 978, 982, 989, 996, 1001], 'wmo_basin': ['north_atlantic', 'north_atlantic', 'north_atlantic', 'north_atlantic', 'north_atlantic', 'north_atlantic', 'north_atlantic', 'north_atlantic', 'north_atlantic', 'north_atlantic', 'north_atlantic', 'north_atlantic', 'north_atlantic', 'north_atlantic', 'north_atlantic', 'north_atlantic', 'north_atlantic', 'north_atlantic', 'north_atlantic', 'north_atlantic', 'north_atlantic', 'north_atlantic', 'north_atlantic', 'north_atlantic', 'north_atlantic', 'north_atlantic', 'north_atlantic', 'north_atlantic', 'north_atlantic', 'north_atlantic', 'north_atlantic', 'north_atlantic', 'north_atlantic', 'north_atlantic', 'north_atlantic', 'north_atlantic', 'north_atlantic', 'north_atlantic'], 'ace': 12.505}
Retrieve xarray Dataset object with Michael’s data:
print(storm.to_xarray())
<xarray.Dataset>
Dimensions:    (time: 38)
Coordinates:
  * time       (time) datetime64[ns] 2018-10-06T18:00:00 ... 2018-10-15T18:00:00
Data variables:
    extra_obs  (time) int64 0 0 0 0 0 0 0 0 0 0 0 0 ... 0 0 0 0 0 0 0 0 0 0 0 0
    special    (time) <U1 '' '' '' '' '' '' '' '' '' ... '' '' '' '' '' '' '' ''
    type       (time) <U2 'LO' 'LO' 'TD' 'TS' 'TS' ... 'EX' 'EX' 'EX' 'EX' 'EX'
    lat        (time) float64 17.8 18.1 18.4 18.8 19.1 ... 45.9 44.4 42.8 41.2
    lon        (time) float64 -86.6 -86.9 -86.8 -86.4 ... -11.4 -10.3 -10.0
    vmax       (time) int64 25 25 30 35 45 50 60 65 ... 65 65 60 55 55 50 35 35
    mslp       (time) int64 1006 1004 1004 1003 999 996 ... 978 982 989 996 1001
    wmo_basin  (time) <U14 'north_atlantic' ... 'north_atlantic'
Attributes:
    id:              AL142018
    operational_id:  AL142018
    name:            MICHAEL
    year:            2018
    season:          2018
    basin:           north_atlantic
    source_info:     NHC Hurricane Database
    source:          hurdat
    ace:             12.505
Retrieve pandas DataFrame object with Michael’s data:
print(storm.to_dataframe())
                  time  extra_obs special type   lat   lon  vmax  mslp       wmo_basin
0  2018-10-06 18:00:00          0           LO  17.8 -86.6    25  1006  north_atlantic
1  2018-10-07 00:00:00          0           LO  18.1 -86.9    25  1004  north_atlantic
2  2018-10-07 06:00:00          0           TD  18.4 -86.8    30  1004  north_atlantic
3  2018-10-07 12:00:00          0           TS  18.8 -86.4    35  1003  north_atlantic
4  2018-10-07 18:00:00          0           TS  19.1 -85.7    45   999  north_atlantic
5  2018-10-08 00:00:00          0           TS  19.7 -85.5    50   996  north_atlantic
6  2018-10-08 06:00:00          0           TS  20.2 -85.4    60   984  north_atlantic
7  2018-10-08 12:00:00          0           HU  20.9 -85.1    65   982  north_atlantic
8  2018-10-08 18:00:00          0           HU  21.7 -85.1    75   977  north_atlantic
9  2018-10-09 00:00:00          0           HU  22.7 -85.2    85   971  north_atlantic
10 2018-10-09 06:00:00          0           HU  23.7 -85.8    85   973  north_atlantic
11 2018-10-09 12:00:00          0           HU  24.6 -86.2    90   968  north_atlantic
12 2018-10-09 18:00:00          0           HU  25.6 -86.4   100   961  north_atlantic
13 2018-10-10 00:00:00          0           HU  26.6 -86.5   110   952  north_atlantic
14 2018-10-10 06:00:00          0           HU  27.7 -86.6   120   945  north_atlantic
15 2018-10-10 12:00:00          0           HU  29.0 -86.3   125   934  north_atlantic
16 2018-10-10 17:30:00          1       L   HU  30.0 -85.5   140   919  north_atlantic
17 2018-10-10 18:00:00          0           HU  30.2 -85.4   135   920  north_atlantic
18 2018-10-11 00:00:00          0           HU  31.5 -84.5    80   957  north_atlantic
19 2018-10-11 06:00:00          0           TS  32.8 -83.2    50   979  north_atlantic
20 2018-10-11 12:00:00          0           TS  34.1 -81.7    45   987  north_atlantic
21 2018-10-11 18:00:00          0           TS  35.6 -80.0    45   991  north_atlantic
22 2018-10-12 00:00:00          0           EX  36.5 -77.7    50   988  north_atlantic
23 2018-10-12 06:00:00          0           EX  37.3 -75.0    60   983  north_atlantic
24 2018-10-12 12:00:00          0           EX  39.1 -70.6    60   980  north_atlantic
25 2018-10-12 18:00:00          0           EX  41.1 -66.1    60   977  north_atlantic
26 2018-10-13 00:00:00          0           EX  43.1 -61.5    65   975  north_atlantic
27 2018-10-13 06:00:00          0           EX  44.8 -55.7    65   975  north_atlantic
28 2018-10-13 12:00:00          0           EX  46.4 -48.2    65   975  north_atlantic
29 2018-10-13 18:00:00          0           EX  47.6 -40.7    65   975  north_atlantic
30 2018-10-14 00:00:00          0           EX  48.4 -33.1    65   975  north_atlantic
31 2018-10-14 06:00:00          0           EX  48.8 -26.1    65   975  north_atlantic
32 2018-10-14 12:00:00          0           EX  48.6 -20.7    60   975  north_atlantic
33 2018-10-14 18:00:00          0           EX  47.5 -16.4    55   978  north_atlantic
34 2018-10-15 00:00:00          0           EX  45.9 -13.5    55   982  north_atlantic
35 2018-10-15 06:00:00          0           EX  44.4 -11.4    50   989  north_atlantic
36 2018-10-15 12:00:00          0           EX  42.8 -10.3    35   996  north_atlantic
37 2018-10-15 18:00:00          0           EX  41.2 -10.0    35  1001  north_atlantic
Visualize Michael’s observed track with the “plot” function:
Note that you can pass various arguments to the plot function, such as customizing the map and track aspects. The “Customizing Storm Plots” example script has more examples on how to customize this plot. Read through the documentation for more customization options.
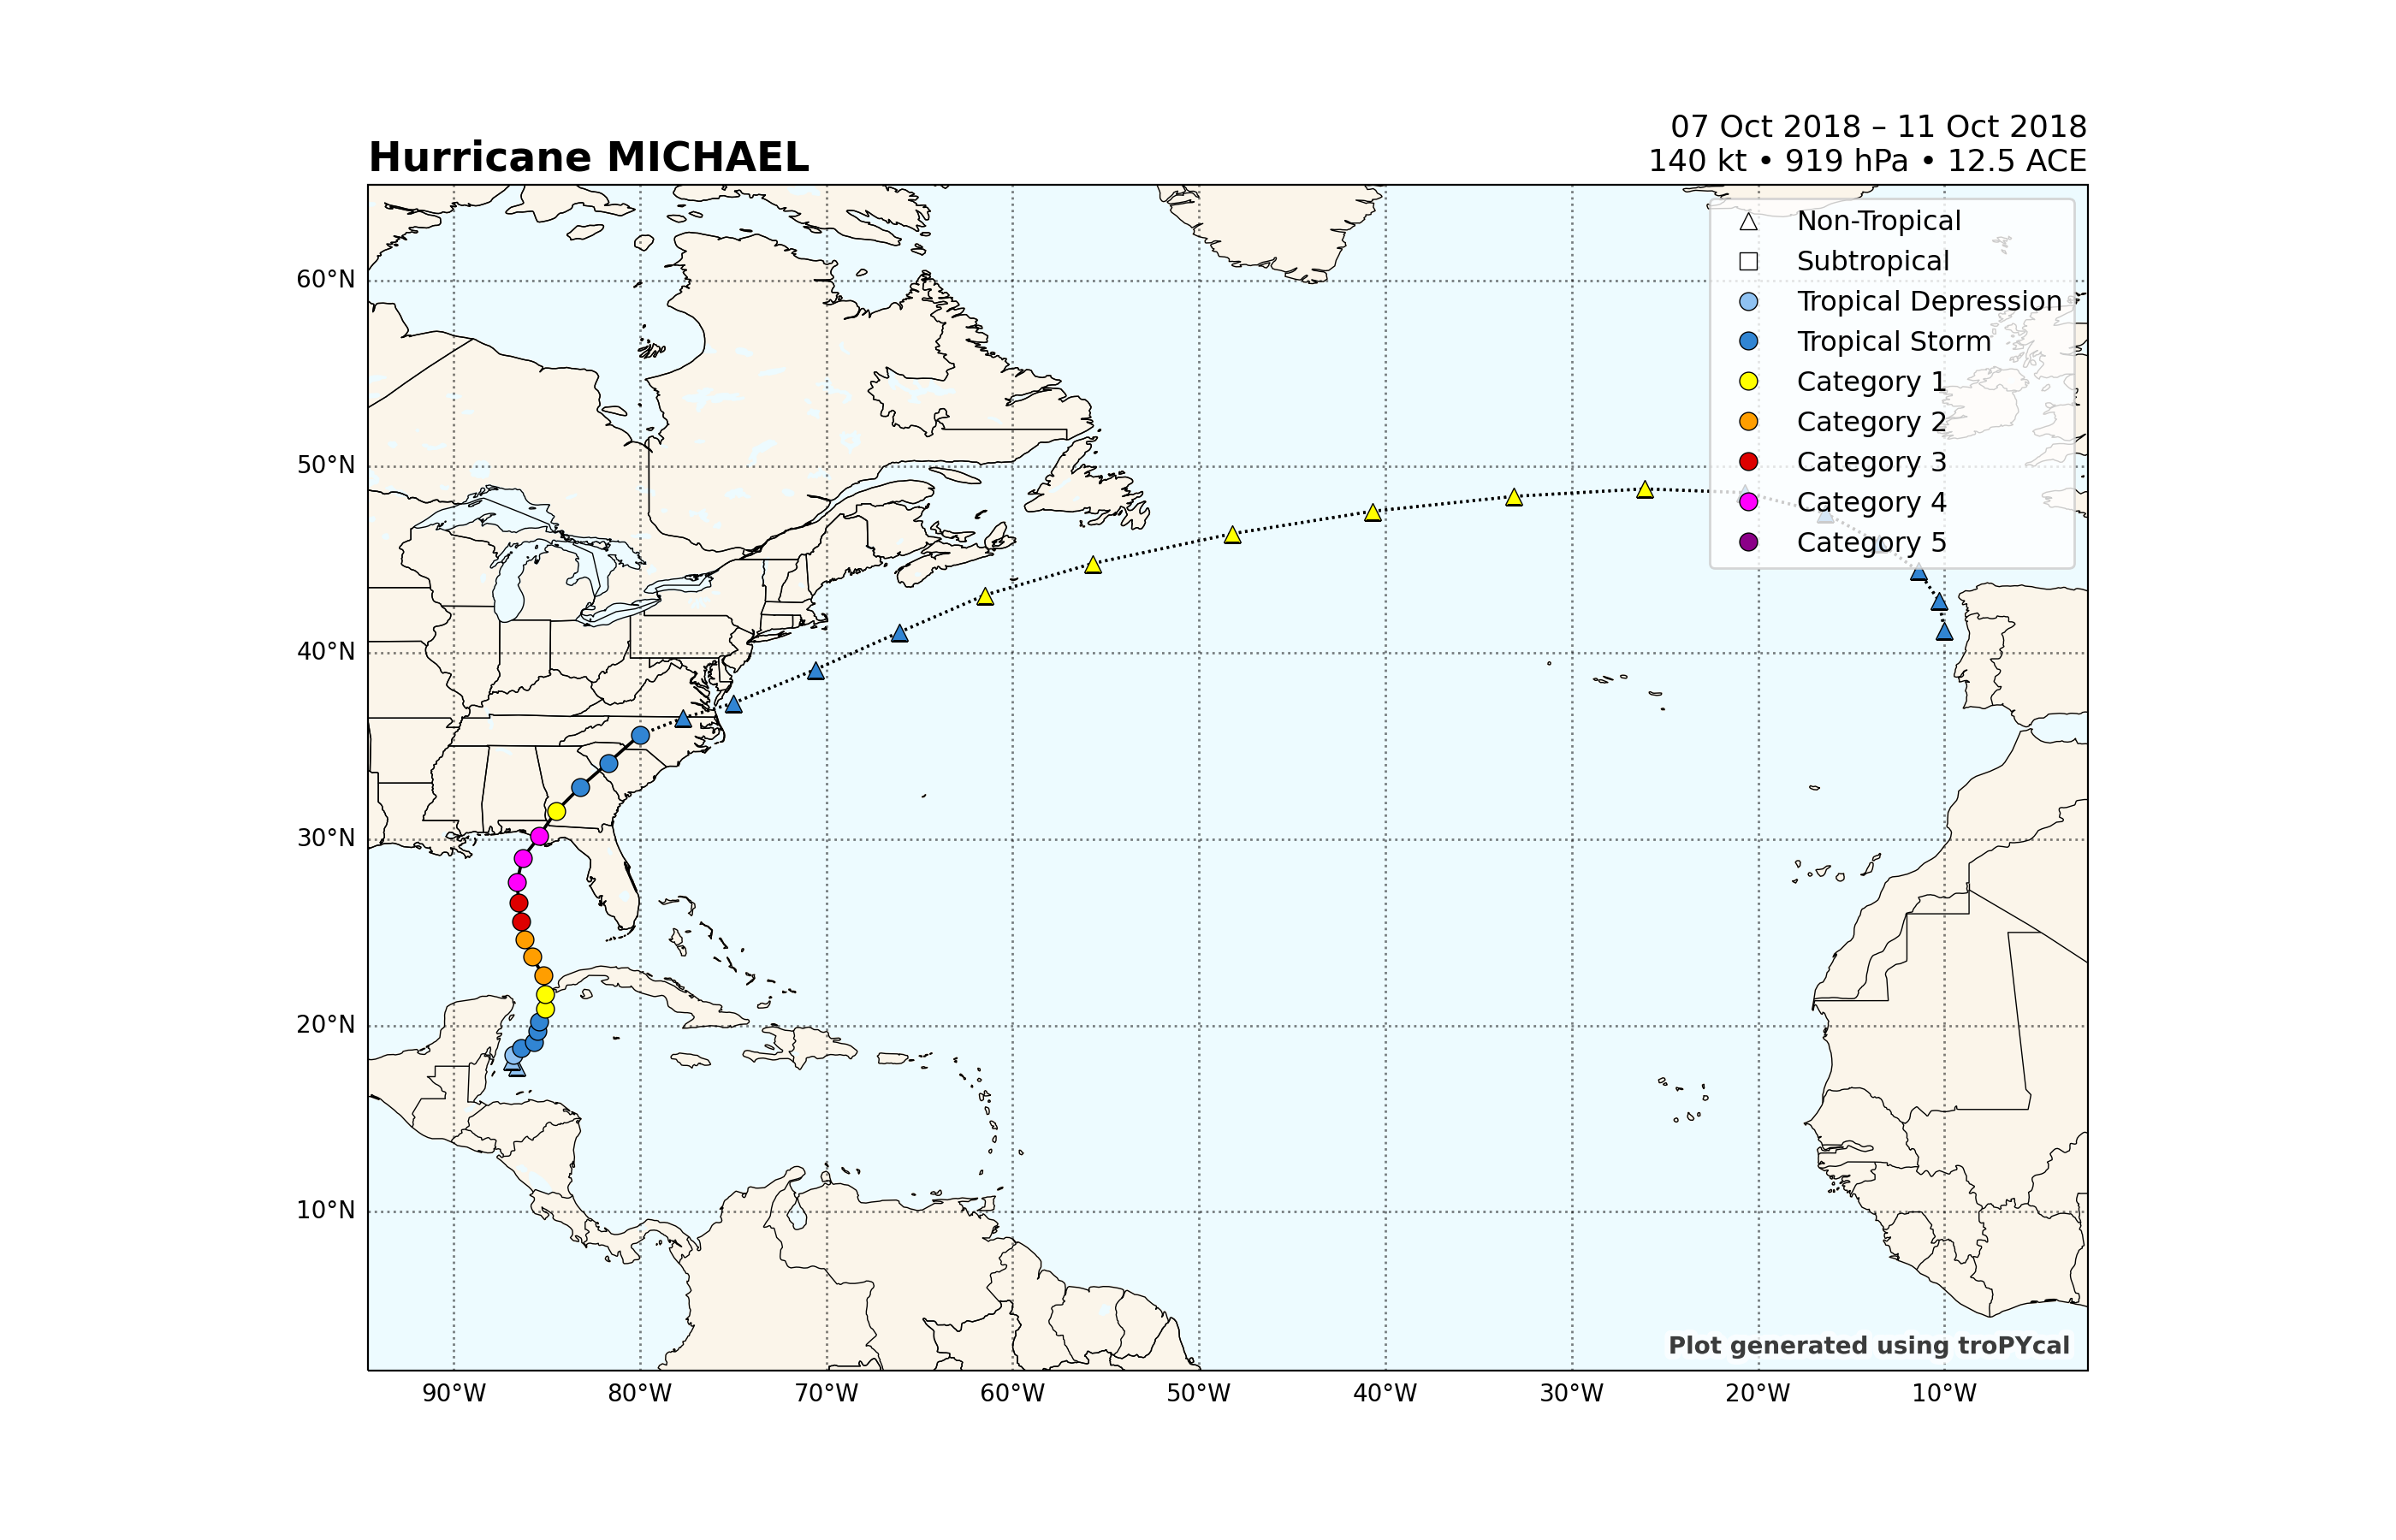
<GeoAxes: title={'left': 'Hurricane MICHAEL', 'right': '07 Oct 2018 – 11 Oct 2018\n140 kt • 919 hPa • 12.5 ACE'}>
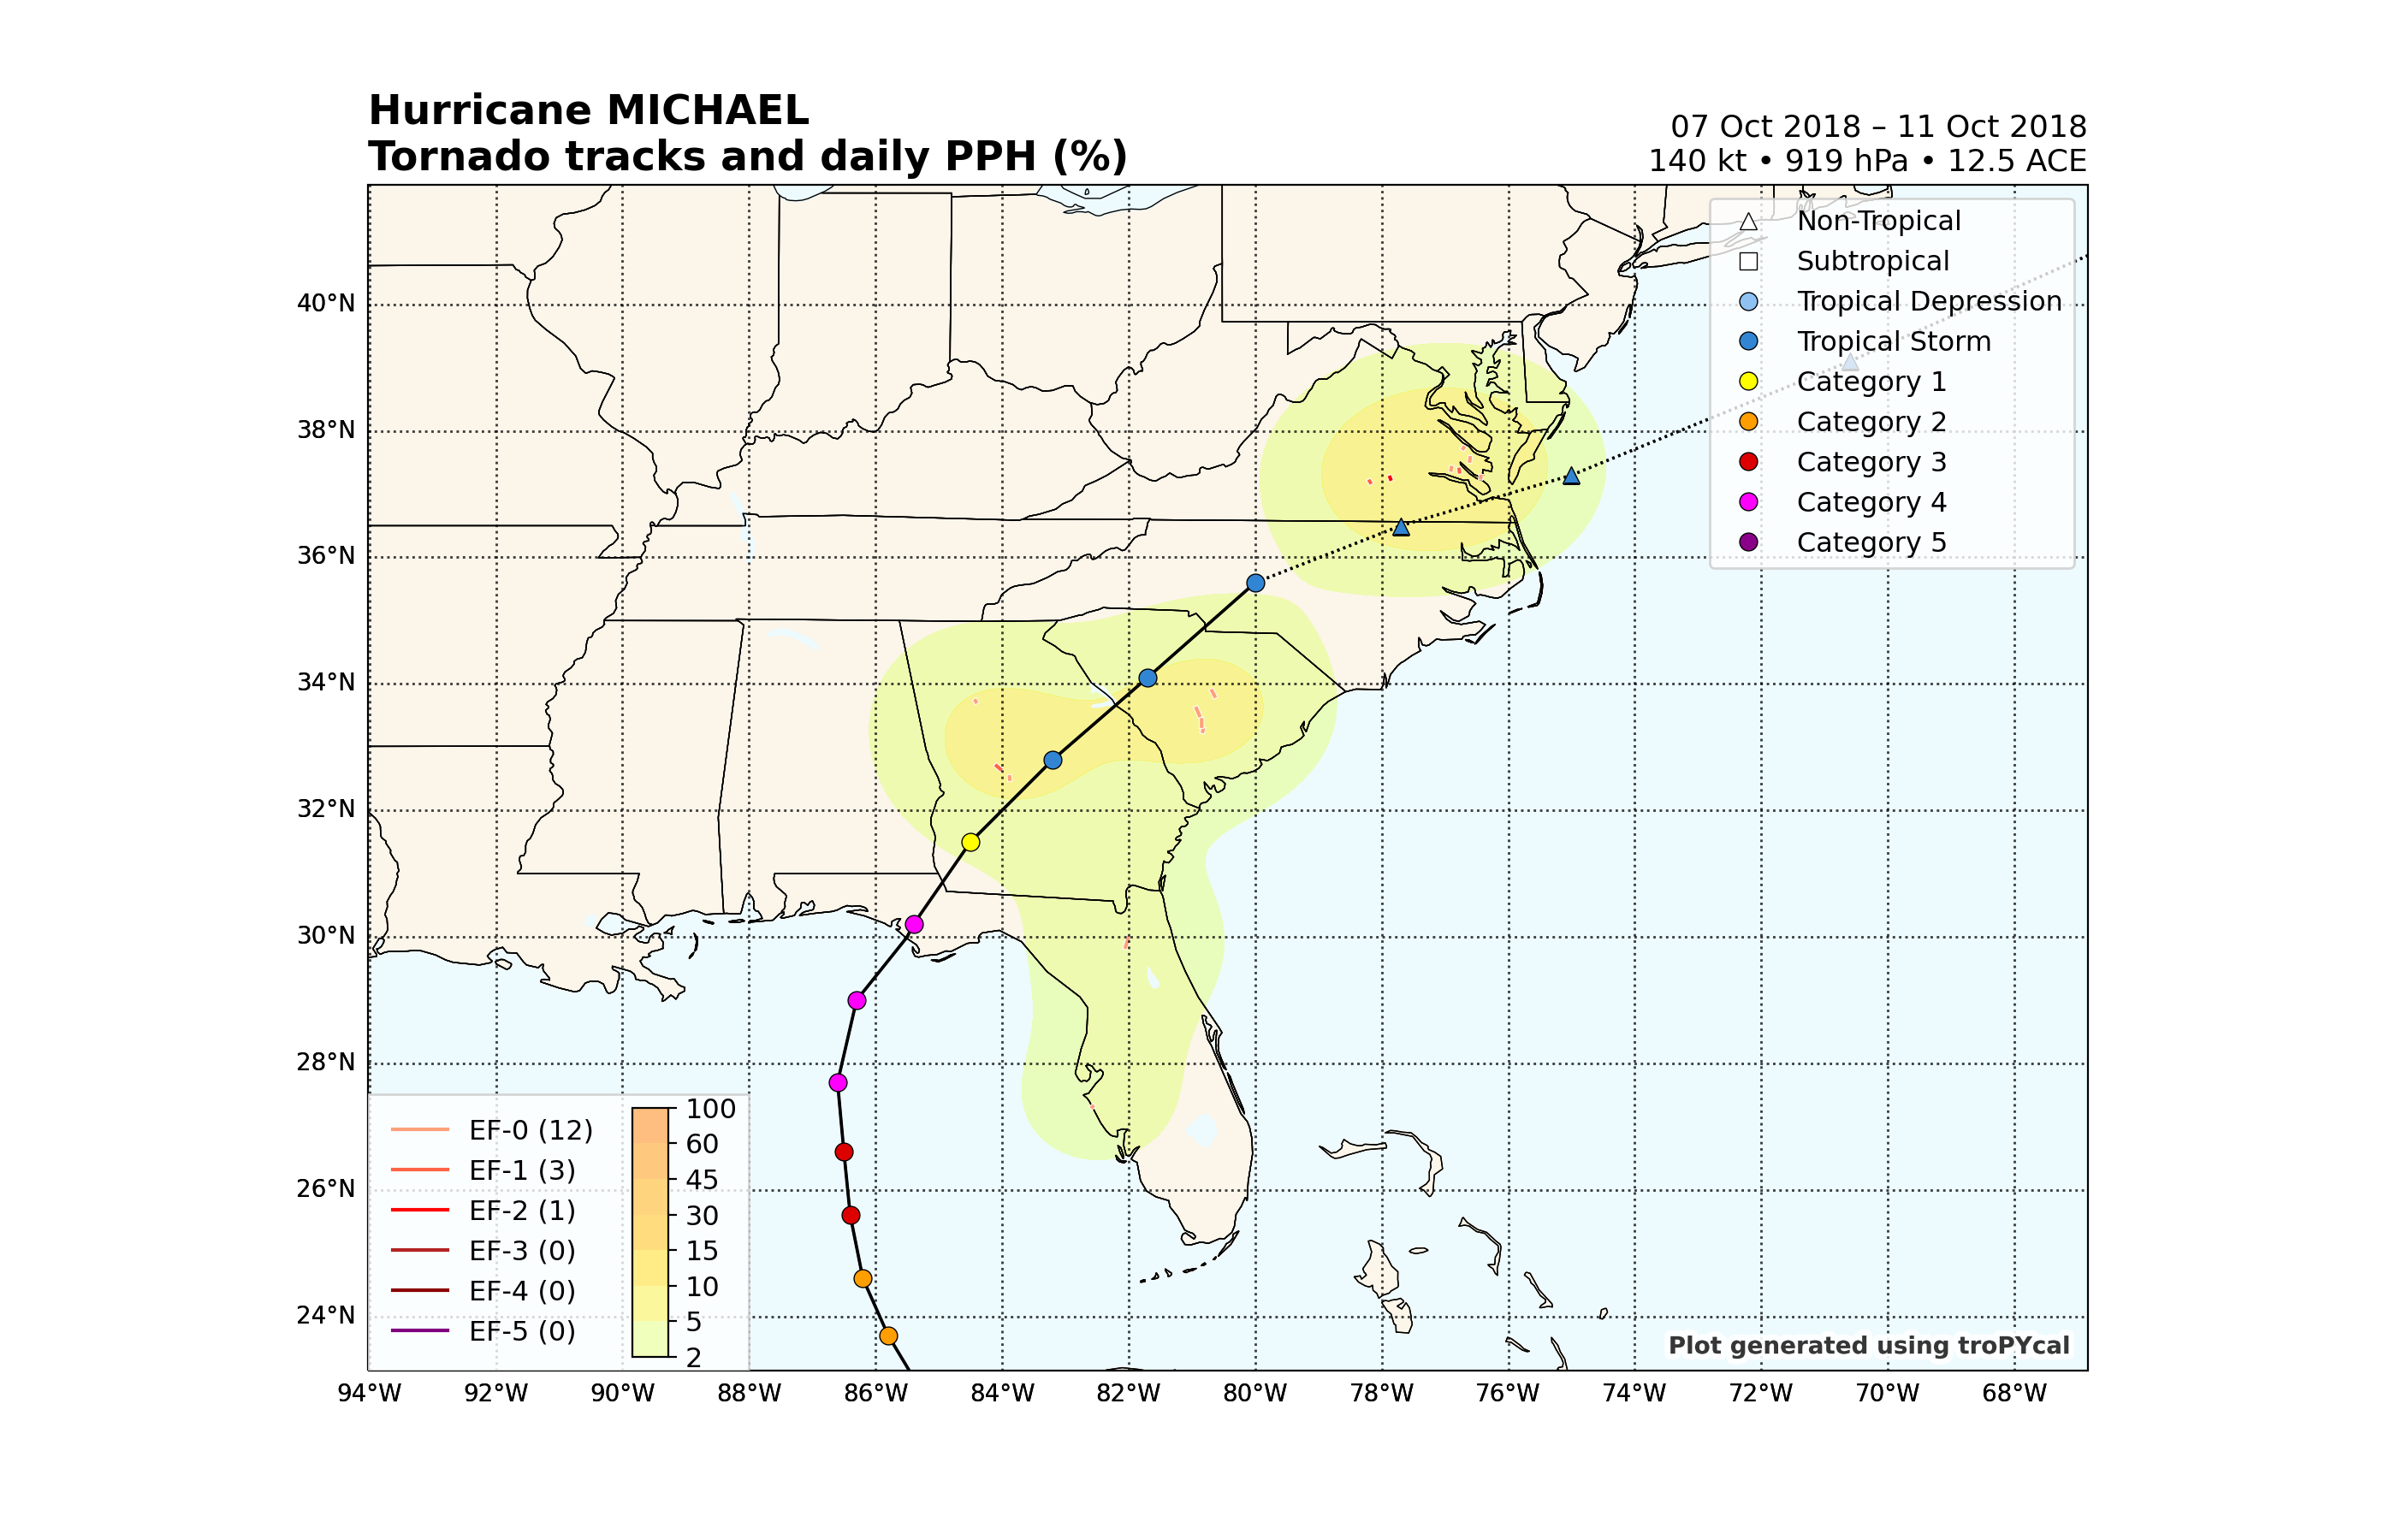
Plot the tornado tracks associated with Michael, along with the accompanying daily practically perfect forecast (PPH):
storm.plot_tors(plotPPH=True)
--> Starting to read in tornado track data
--> Completed reading in tornado data for 1950-2022 (6.12 seconds)

<GeoAxes: title={'left': 'Hurricane MICHAEL\nTornado tracks and daily PPH (%)', 'right': '07 Oct 2018 – 11 Oct 2018\n140 kt • 919 hPa • 12.5 ACE'}>
If this storm was ever in NHC’s area of responsibility, you can retrieve operational NHC forecast data for this event provided it is available. Forecast discussions date back to 1992, and forecast tracks date back to 1954.
Retrieve a single forecast discussion for Michael:
#Method 1: Specify date closest to desired discussion
disco = storm.get_nhc_discussion(forecast=dt.datetime(2018,10,7,0))
print(disco['text'])

#Method 2: Specify forecast discussion ID
disco = storm.get_nhc_discussion(forecast=2)
#print(disco['text']) printing this would show the same output
ZCZC MIATCDAT4 ALL
TTAA00 KNHC DDHHMM

Potential Tropical Cyclone Fourteen Discussion Number   1
NWS National Hurricane Center Miami FL       AL142018
400 PM CDT Sat Oct 06 2018

Satellite imagery and surface observations indicate that the
circulation of the low pressure area in the northwestern Caribbean
Sea is getting better defined, and that the associated convection
is becoming better organized.  While the system is currently not
well enough organized to call it a tropical depression, current
indications in the global models and the intensity guidance are that
the system will develop into a tropical cyclone within 24 h and
could bring tropical storm conditions to portions of western Cuba
and the northeastern Yucatan Peninsula.  Based on the need for
warnings and watches in these areas, advisories are being initiated
on Potential Tropical Cyclone Fourteen.

Although the intensity guidance is in excellent agreement that the
system should strengthen through the forecast period, the global
models indicate that shear caused by an upper-level trough over the
Gulf of Mexico will persist through at least 48 h.  In addition, the
strongest winds are currently well removed from the center, which is
likely to slow development.  Based on this, the intensity forecast
is in the lower part of the guidance envelope through 48 h, and then
shows a faster rate of development from 48-96 h when the shear is
forecast to diminish.  The intensity forecast is closest to a blend
of the IVCN and HCCA consensus models.

For the first 24-48 h, the disturbance should move generally
northward on the western side of a weak mid-level ridge over the
Caribbean Sea.  After that time, a large mid-latitude trough over
the central United States and a mid- to upper-level ridge over the
western Atlantic should steer the system generally northward at a
faster forward speed, with the system expected to move near or over
the northern Gulf coast in about 96 h.  After landfall, the system
is likely to recurve northeastward into the westerlies.  The track
guidance is in good overall agreement with this scenario.  However,
it should be noted that there is a nearly 300 n mi cross-track
spread in the guidance at the 96-h point.  The forecast track lies
just to the west of the various consensus models.

Key Messages for Potential Tropical Cyclone Fourteen:

1.  This system is expected to produce heavy rainfall and flash
flooding over portions of Central America, western Cuba, and the
northeastern Yucatan Peninsula of Mexico during the next couple of
days.  The system is also forecast to become a tropical storm by
Sunday night and tropical storm conditions are expected over
portions of western Cuba where a Tropical Storm Warning is in
effect.

2. The system could bring storm surge, rainfall, and wind impacts to
portions of the northern Gulf Coast by mid-week, although it is too
soon to specify the exact location and magnitude of these impacts.
Residents in these areas should monitor the progress of this system.

FORECAST POSITIONS AND MAX WINDS

INIT  06/2100Z 18.0N  86.6W   25 KT  30 MPH...POTENTIAL TROP CYCLONE
 12H  07/0600Z 18.7N  86.7W   25 KT  30 MPH
 24H  07/1800Z 19.9N  86.6W   30 KT  35 MPH...TROPICAL CYCLONE
 36H  08/0600Z 21.0N  86.6W   35 KT  40 MPH
 48H  08/1800Z 22.5N  86.7W   40 KT  45 MPH
 72H  09/1800Z 26.0N  87.5W   55 KT  65 MPH
 96H  10/1800Z 30.5N  86.5W   60 KT  70 MPH
120H  11/1800Z 35.5N  81.5W   30 KT  35 MPH...INLAND

$$
Forecaster Beven

NNNN
NHC also archives forecast tracks, albeit in a different format than the official advisory data, so the operational forecast IDs here differ from the discussion IDs. As such, the forecast cone is not directly retrieved from NHC, but is generated using an algorithm that yields a cone closely resembling the official NHC cone.
Let’s plot Michael’s second forecast cone:
storm.plot_nhc_forecast(forecast=2)
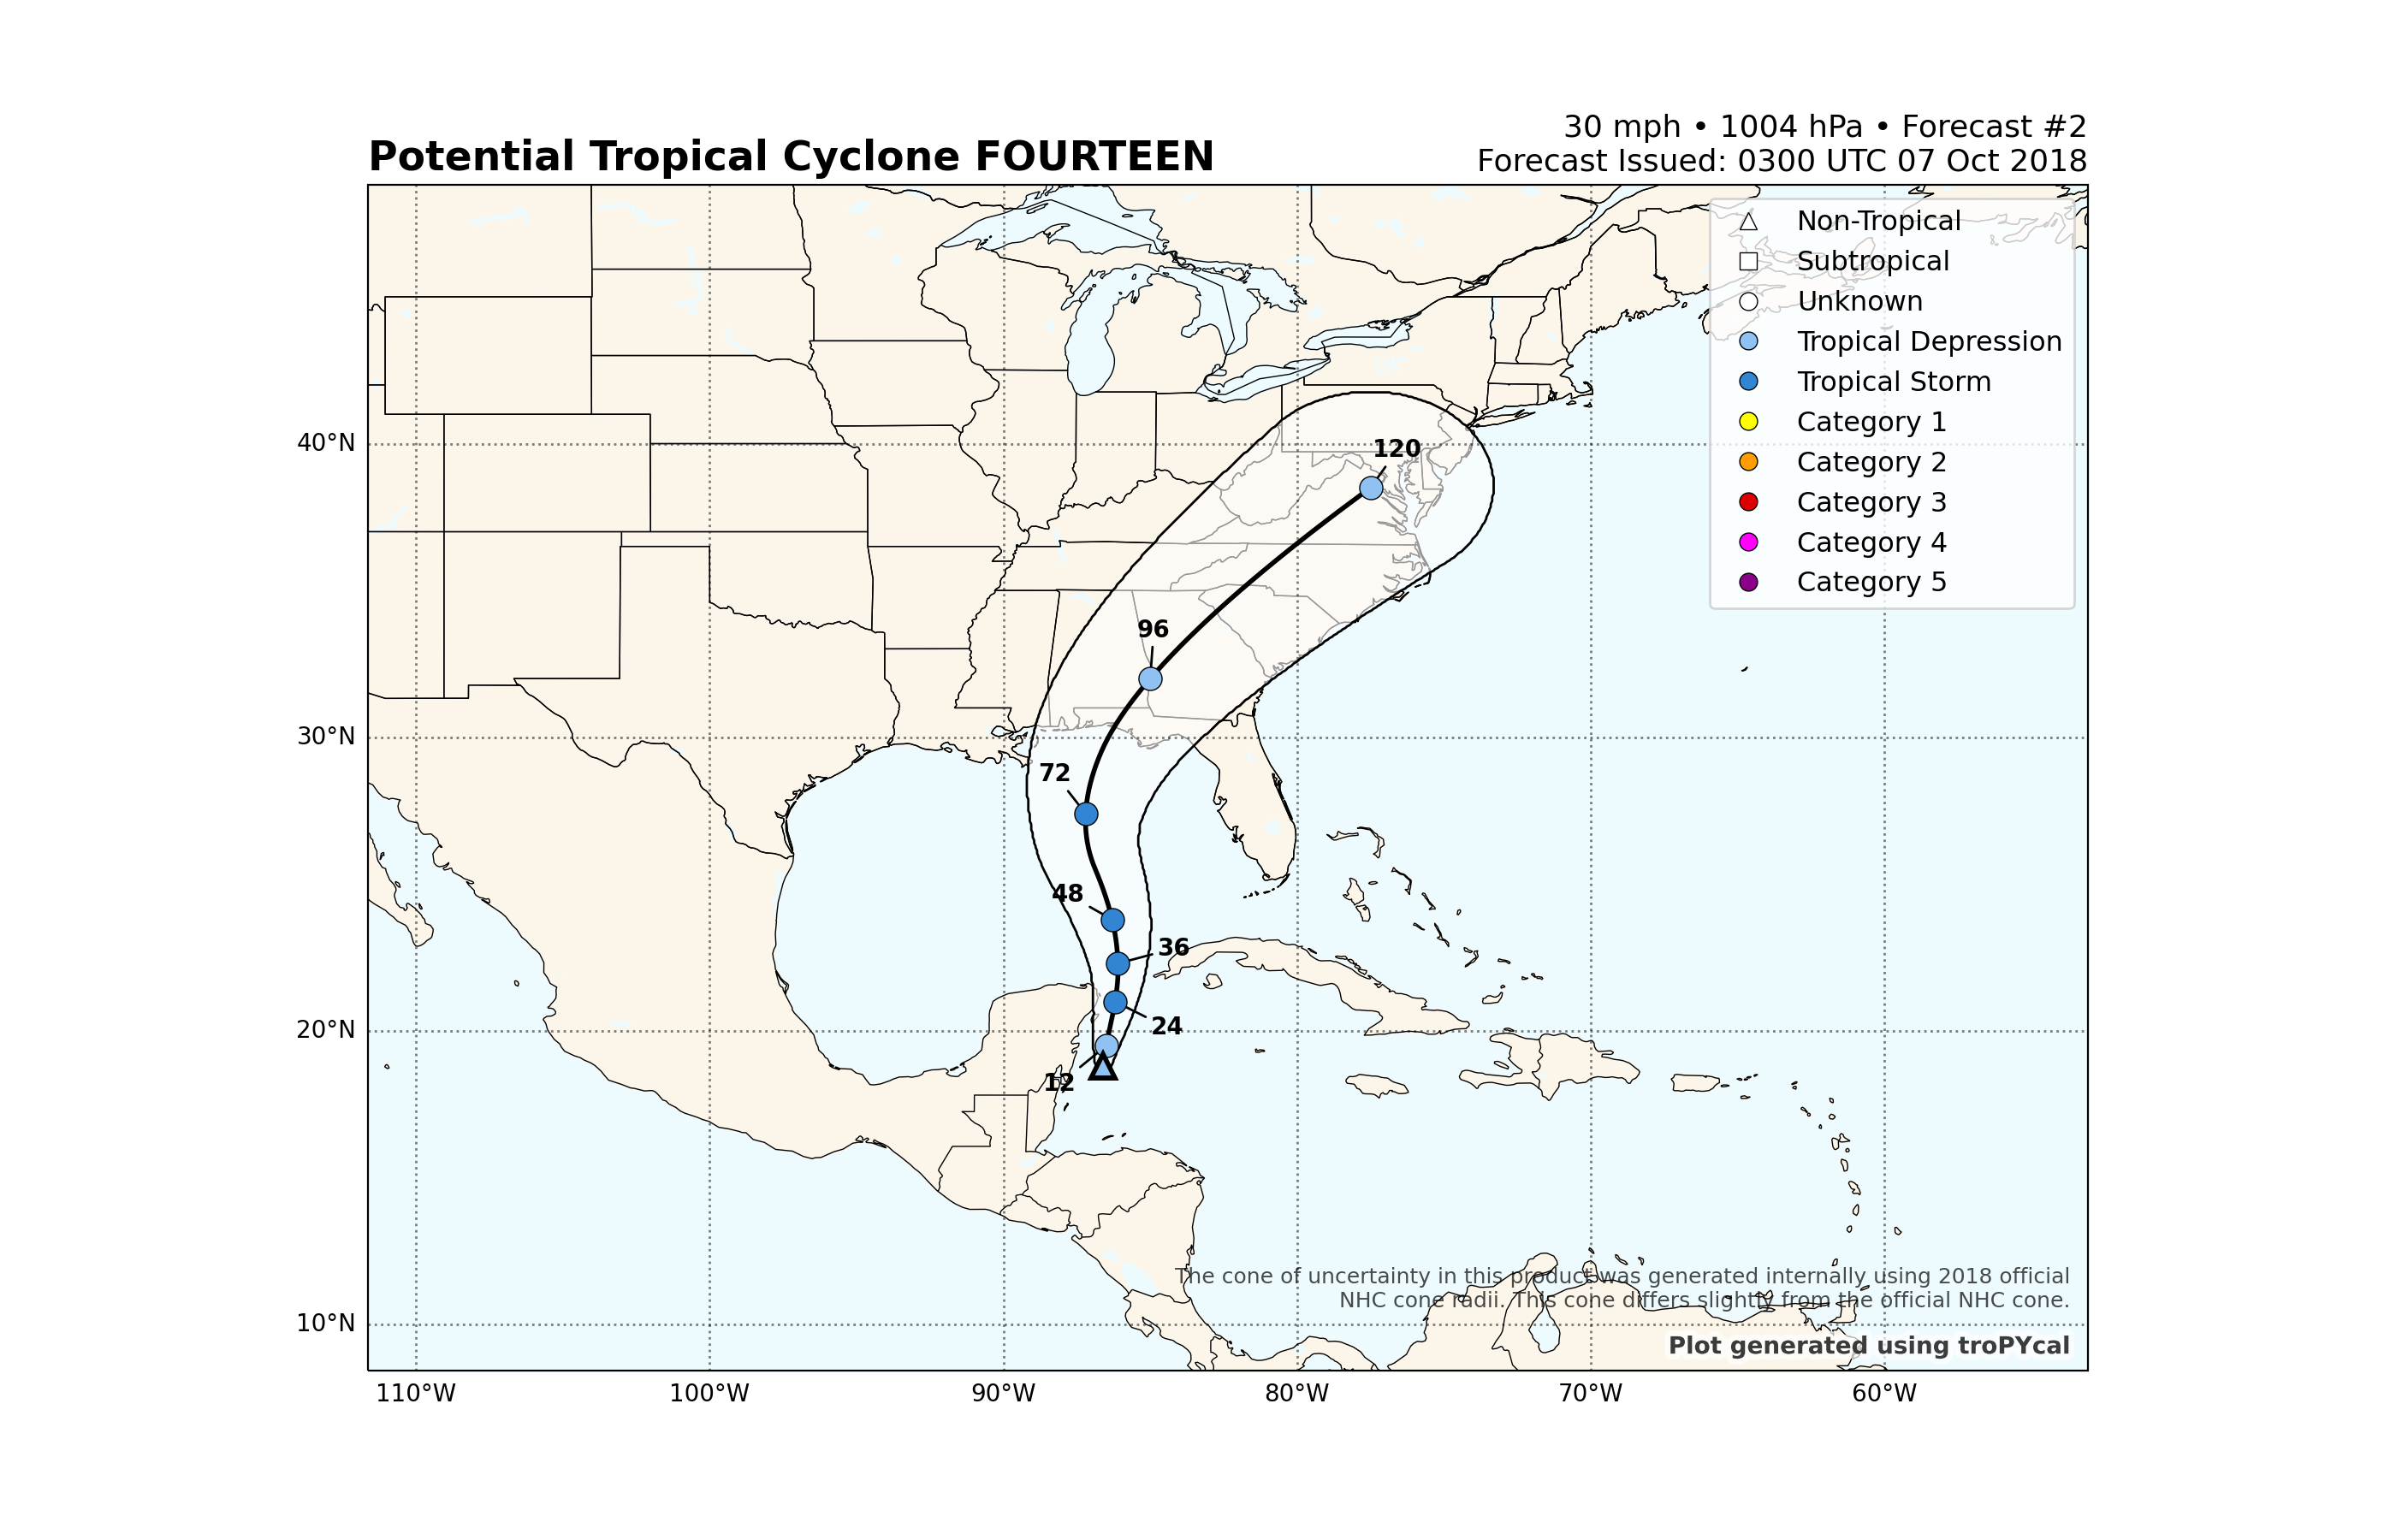
<GeoAxes: title={'left': 'Potential Tropical Cyclone FOURTEEN', 'right': '30 mph • 1004 hPa • Forecast #2\nForecast Issued: 0300 UTC 07 Oct 2018'}>
Now let’s look at the 12th forecast for Michael.
Note that the observed track here differs from the HURDAT2 track plotted previously! This is because this plot displays the operationally analyzed location and intensity, rather than the post-storm analysis data. This is done to account for differences between HURDAT2 and operational data.
storm.plot_nhc_forecast(forecast=12)
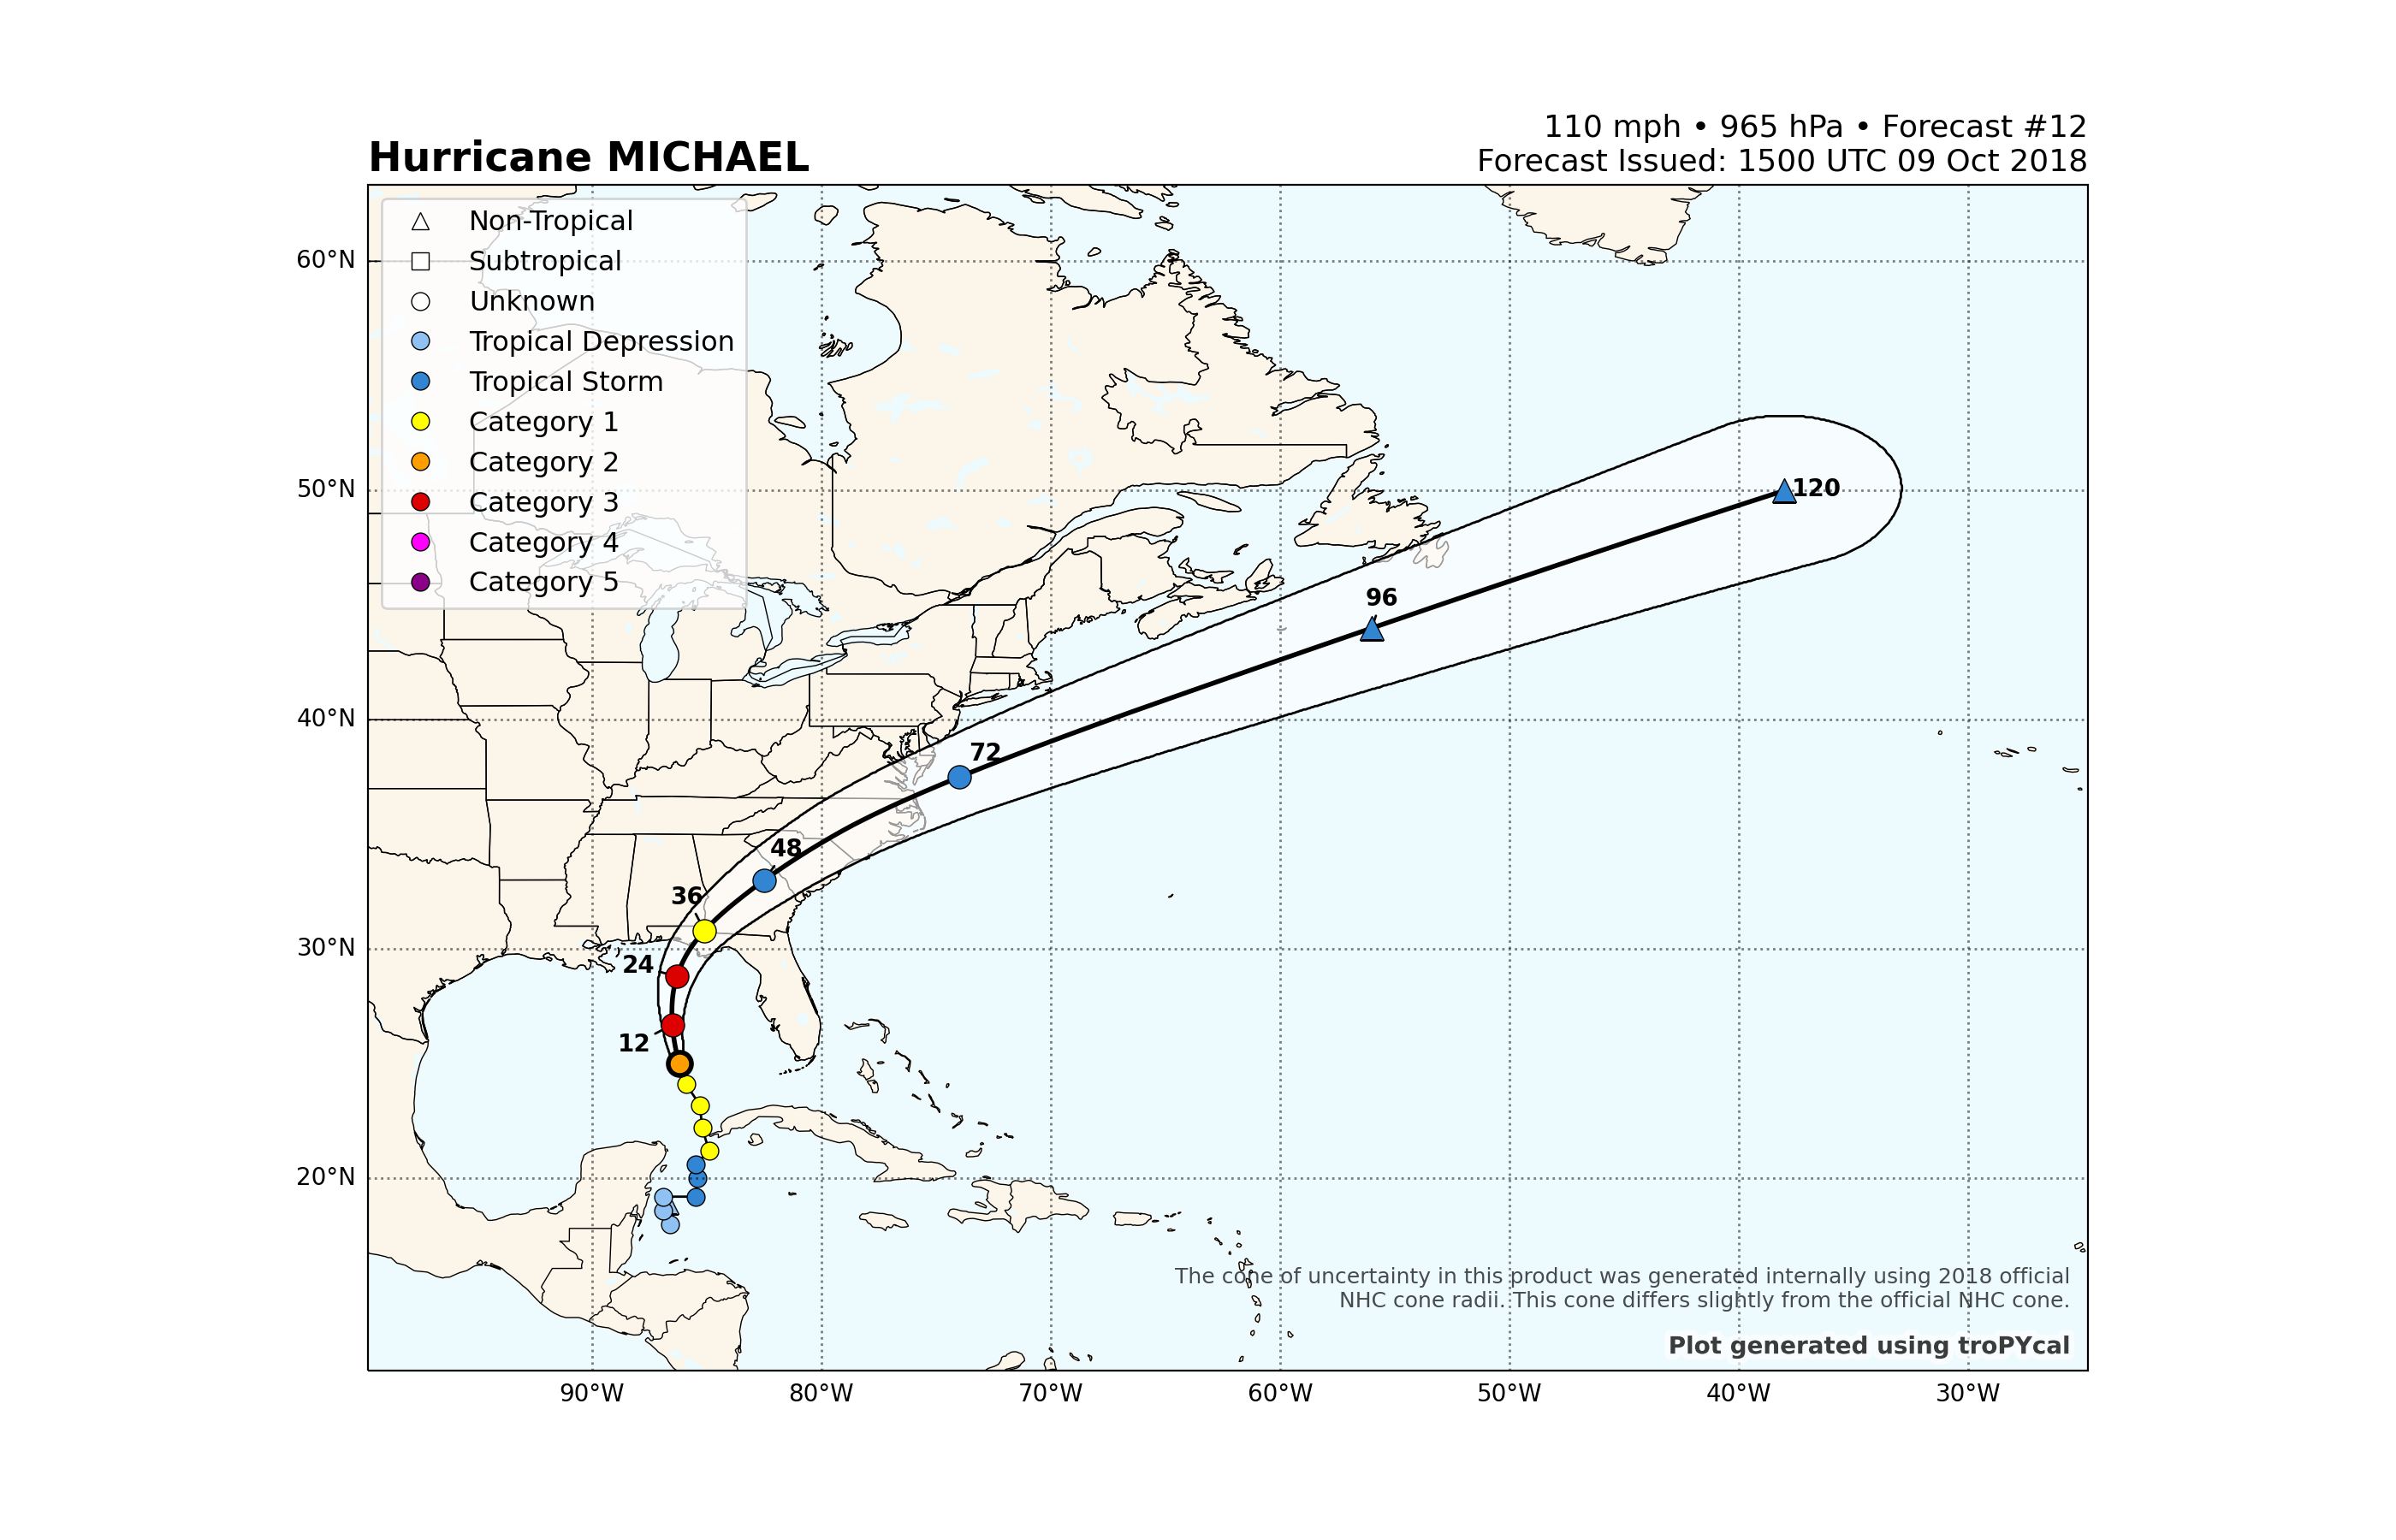
<GeoAxes: title={'left': 'Hurricane MICHAEL', 'right': '110 mph • 965 hPa • Forecast #12\nForecast Issued: 1500 UTC 09 Oct 2018'}>
To get the raw NHC forecast data, we can use the get_nhc_forecast_dict() method, and provide a date for the requested forecast.
This is a subset of the get_operational_forecasts() method, which pulls in all available forecasts whether NHC, deterministic model or ensemble members.
storm.get_nhc_forecast_dict(dt.datetime(2018,10,9,18))
{'init': datetime.datetime(2018, 10, 9, 18, 0), 'fhr': [0, 3, 12, 24, 36, 48, 72, 96, 120], 'lat': [25.5, 26.0, 27.6, 29.7, 31.8, 33.9, 39.0, 45.5, 50.0], 'lon': [-86.4, -86.4, -86.6, -85.9, -84.1, -81.0, -70.0, -51.0, -30.0], 'vmax': [105, 105, 110, 110, 60, 45, 55, 55, 45], 'mslp': [nan, 957, nan, nan, nan, nan, nan, nan, nan], 'type': ['HU', 'HU', 'HU', 'HU', 'TS', 'TS', 'TS', 'EX', 'EX'], 'windrad': [{34: [150, 140, 70, 140], 50: [70, 50, 30, 50], 64: [40, 30, 20, 30]}, {34: [150, 140, 70, 140], 50: [70, 50, 30, 50], 64: [40, 30, 20, 30]}, {34: [150, 140, 70, 140], 50: [70, 60, 40, 50], 64: [35, 30, 25, 30]}, {34: [130, 140, 90, 130], 50: [60, 60, 40, 50], 64: [35, 30, 25, 30]}, {34: [90, 120, 60, 60], 50: [40, 40, 20, 20]}, {34: [50, 140, 40, 40]}, {34: [150, 240, 180, 70], 50: [0, 90, 90, 0]}, {34: [0, 0, 0, 0]}, {34: [0, 0, 0, 0]}]}
IBTrACS Dataset
We can also read in IBTrACS data and use it the same way as we would use HURDAT2 data. There are caveats to using IBTrACS data, however, which are described more in depth in the Data Sources page. We’ll retrieve the global IBTrACS dataset, using the Joint Typhoon Warning Center (JTWC) data, modified with the Neumann reanalysis for southern hemisphere storms, and including a special reanalysis for Cyclone Catarina (2004) in Brazil.
Warning
By default, IBTrACS data is read in from an online source. If you’re reading in the global IBTrACS dataset, this could be quite slow. For global IBTrACS, it is recommended to have the CSV file saved locally (link to data), then set the flag ibtracs_url="local_path".
ibtracs = tracks.TrackDataset(basin='all',source='ibtracs',ibtracs_mode='jtwc_neumann',catarina=True)
--> Starting to read in ibtracs data
--> Completed reading in ibtracs data (77.27 seconds)
The functionality for handling storms in IBTrACS is the same as with using HURDAT2, the only limitation being no NHC and operational model data can be accessed when using IBTrACS as the data source.
Super Typhoon Haiyan (2013) was a catastrophic storm in the West Pacific basin, having made landfall in the Philippines. With estimated sustained winds of 195 mph (170 kt), it is among one of the most powerful tropical cyclones in recorded history. We can illustrate this by making a plot of Haiyan’s observed track and intensity, from JTWC data:
storm = ibtracs.get_storm(('haiyan',2013))
storm.plot()
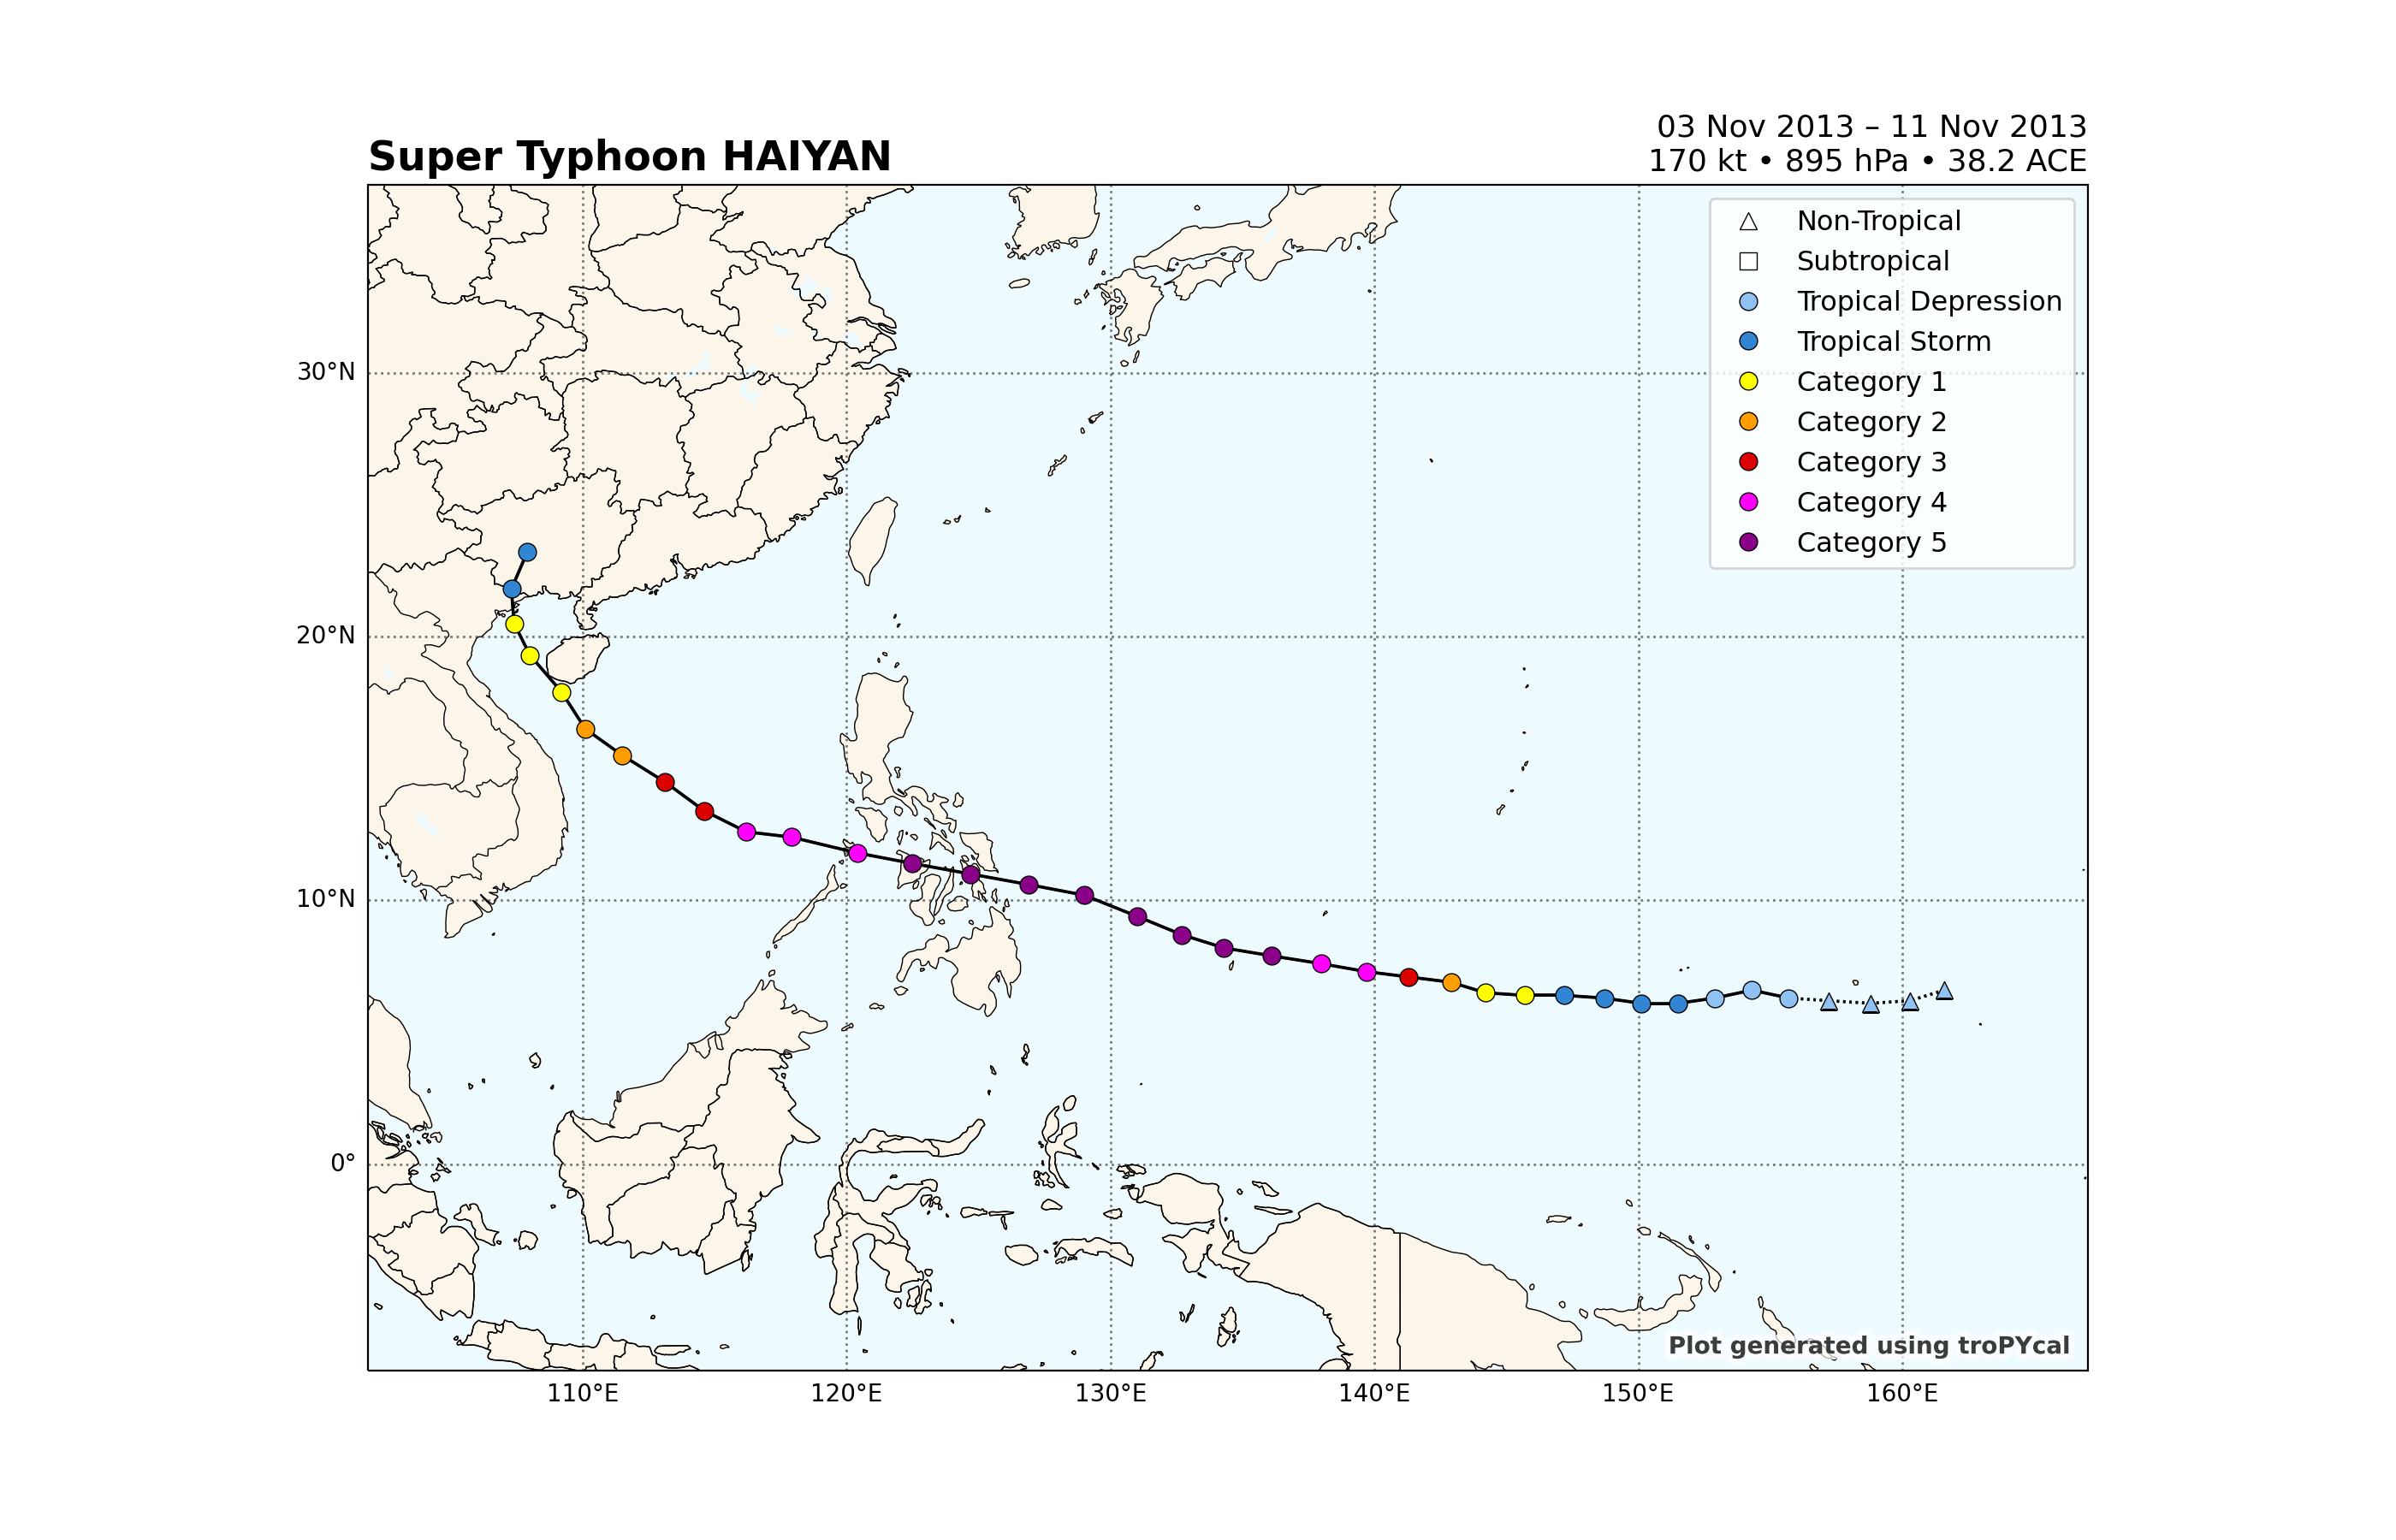
<GeoAxes: title={'left': 'Super Typhoon HAIYAN', 'right': '03 Nov 2013 – 11 Nov 2013\n170 kt • 895 hPa • 38.2 ACE'}>
Cyclone Catarina (2004) was an extremely rare hurricane-force tropical cyclone that developed in the South Atlantic basin, which normally doesn’t see tropical cyclone activity, and subsequently made landfall in Brazil. The “Catarina” name is unofficial; it was not assigned a name in real time, and JTWC assigned it the ID “AL502004”. Recall that when reading in the IBTrACS dataset previously, we set Catarina=True. This read in data for Cyclone Catarina from a special post-storm reanalysis from McTaggart-Cowan et al. (2006). Let’s make a plot of Catarina’s observed track and intensity per this reanalysis:
storm = ibtracs.get_storm(('catarina',2004))
storm.plot()
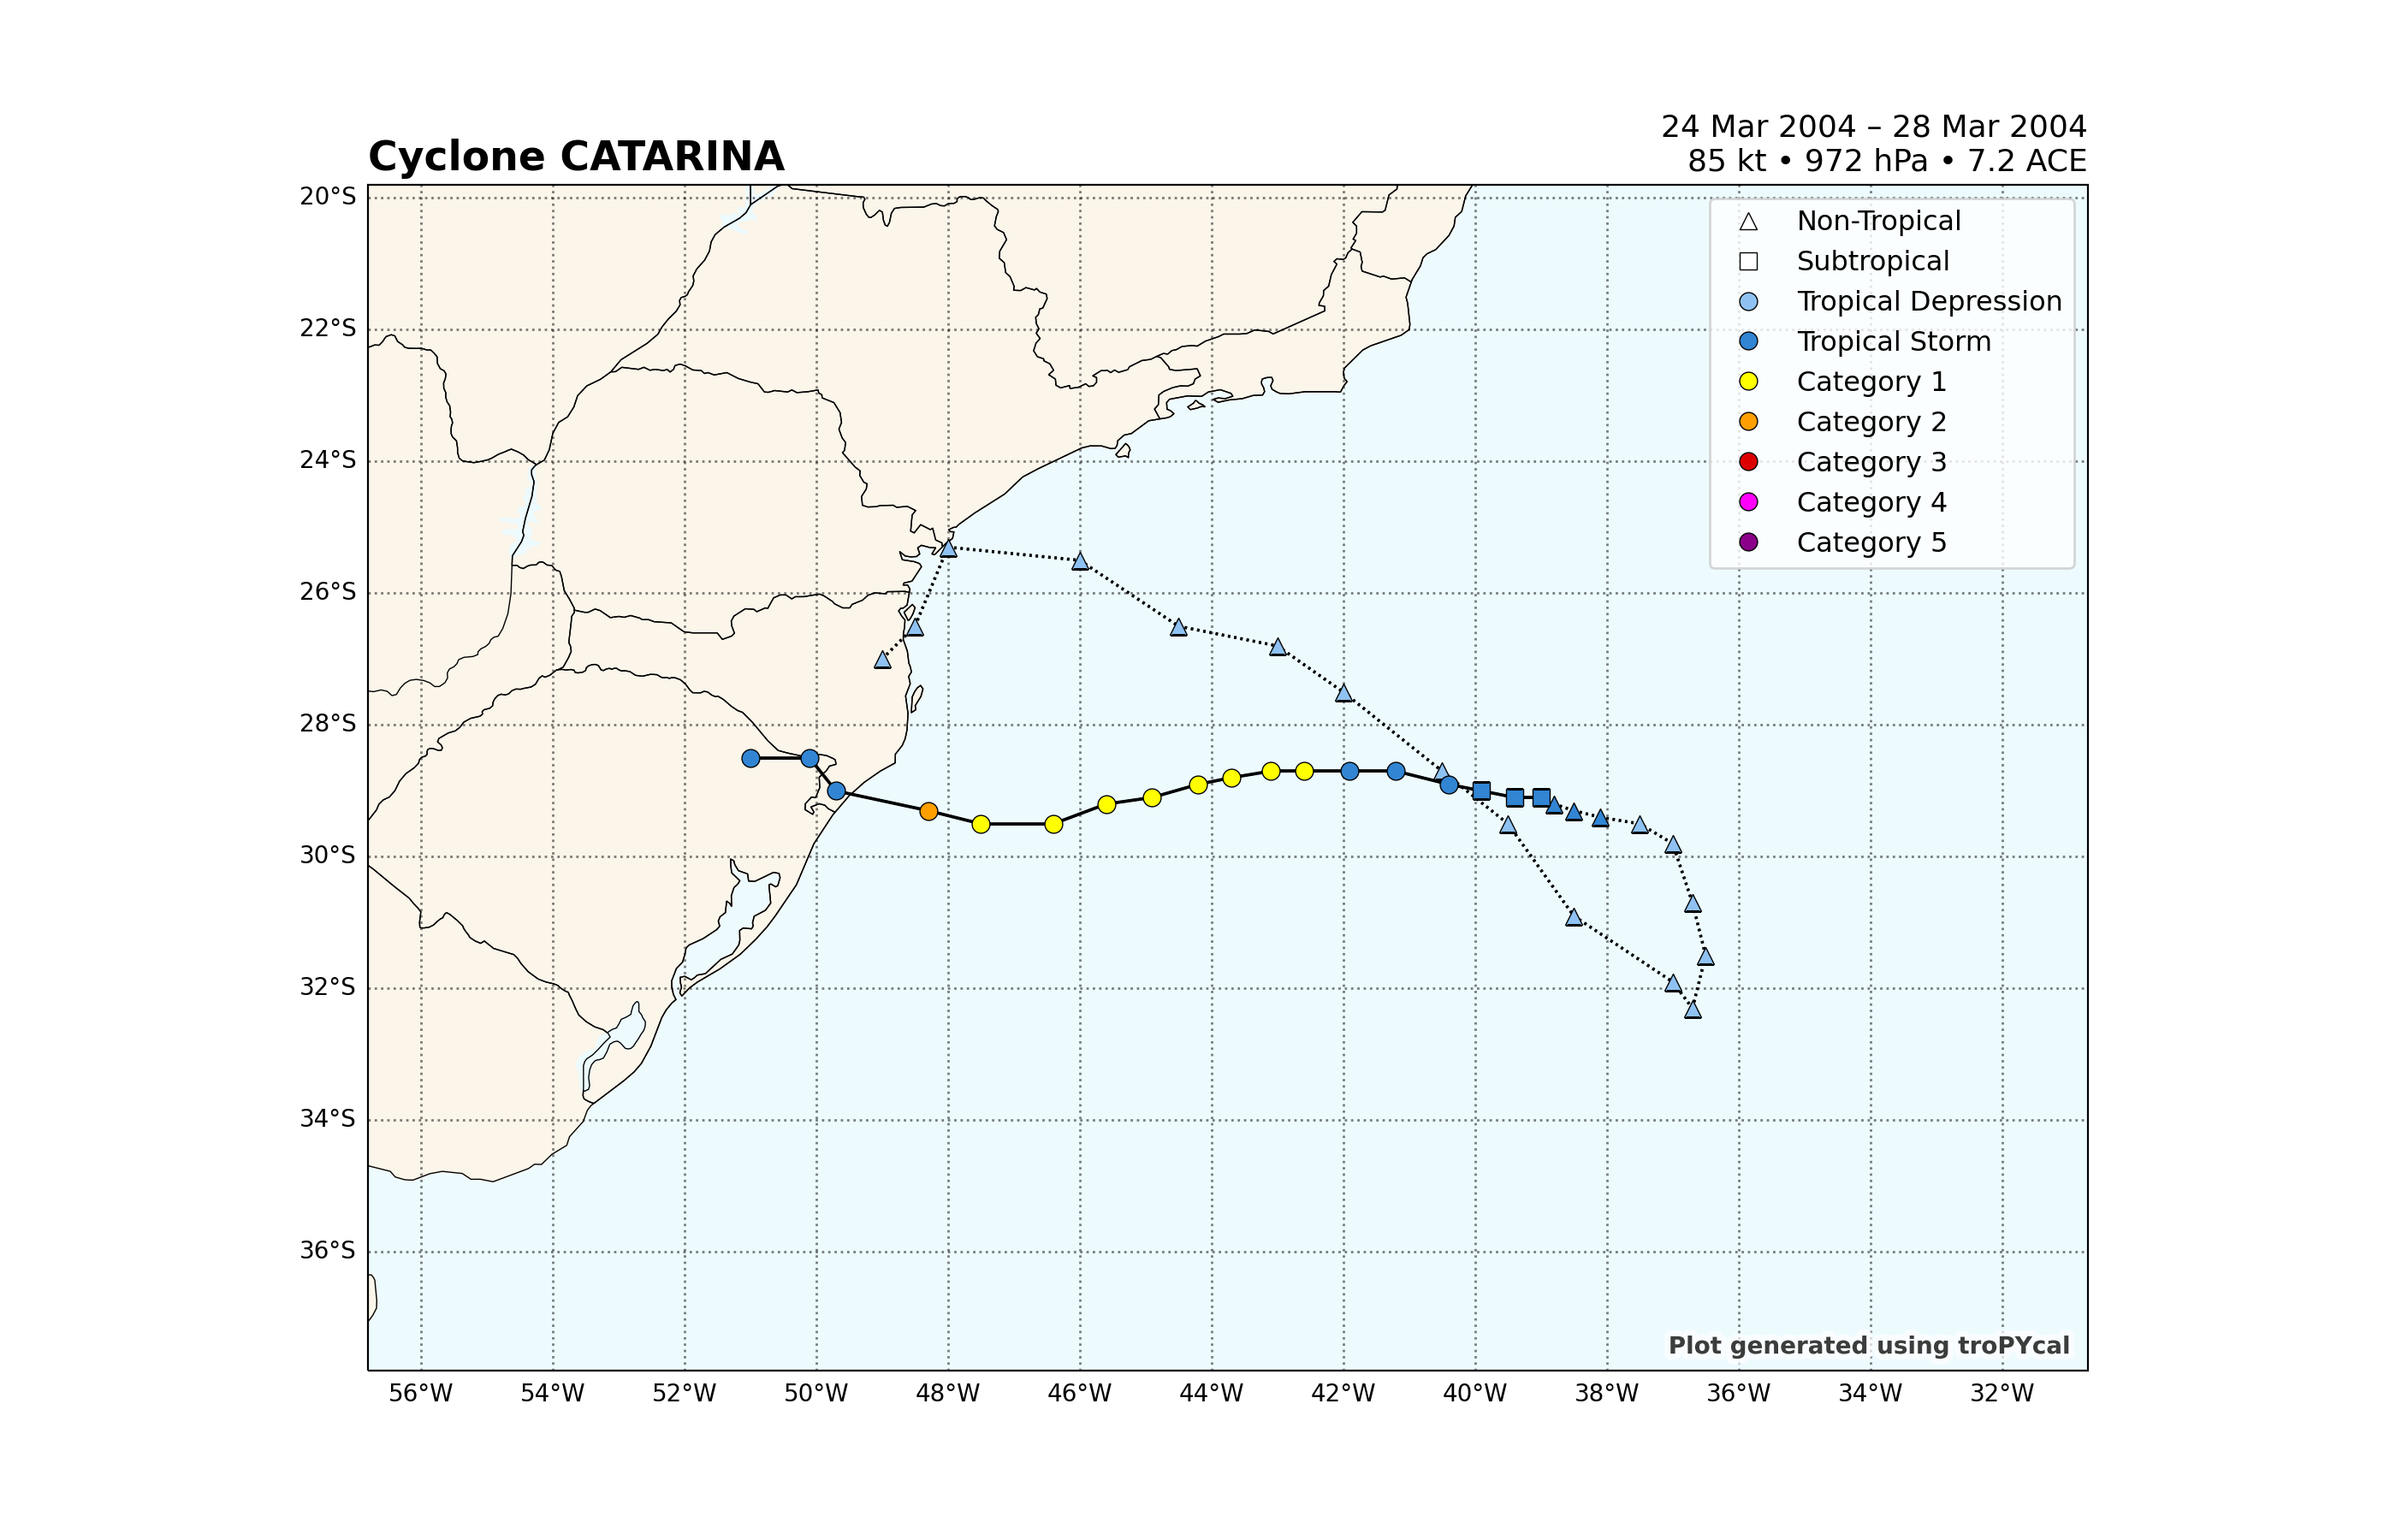
<GeoAxes: title={'left': 'Cyclone CATARINA', 'right': '24 Mar 2004 – 28 Mar 2004\n85 kt • 972 hPa • 7.2 ACE'}>
If we were to read in IBTrACS without setting Catarina=True (which sets it to False by default) and plot the track for “AL502004”, we would get a noticeably different (shorter) and weaker track.
Total running time of the script: ( 1 minutes 44.799 seconds)