Note
Go to the end to download the full example code
Tropical Cyclone Rainfall
This sample script shows how to use Tropycal to retrieve and plot rainfall associated with U.S. tropical cyclones, from the Weather Prediction Center (WPC)’s database.
from tropycal import tracks, rain
Reading In HURTDAT2 Dataset
Let’s start with the HURDAT2 dataset by loading it into memory. By default, this reads in the HURDAT dataset from the National Hurricane Center (NHC) website, unless you specify a local file path using either atlantic_url for the North Atlantic basin on pacific_url for the East & Central Pacific basin.
HURDAT data is not available for the current year. To include the latest data up through today, the “include_btk” flag needs to be set to True, which reads in preliminary best track data from the NHC website. For this example, we’ll set this to False.
Let’s create an instance of a TrackDataset object, which will store the North Atlantic HURDAT2 dataset in memory. Once we have this we can use its methods for various types of analyses.
basin = tracks.TrackDataset(basin='north_atlantic',include_btk=False)
--> Starting to read in HURDAT2 data
--> Completed reading in HURDAT2 data (2.16 seconds)
WPC Rainfall Dataset
Next, we’ll read in rainfall associated with tropical cyclones. Tropical cyclones are known to produce heavy rainfall, with at times catastrophic flooding. The Weather Prediction Center (WPC) routinely issues advisories on tropical cyclones or their remnants inland, and maintains a database of rainfall associated with tropical cyclones in the US.
This dataset is now available in CSV format, and can be easily read into Tropycal using the new Rain module:
--> Starting to read in rainfall data
--> Completed reading in rainfall data (8.87 seconds)
Hurricane Harvey (2017) produced catastrophic flooding over Texas. Let’s pull its rain observations to take a deeper look.
To do so, we’ll first need to retrieve a Storm object for Harvey, then provide it as an input argument to get_storm_rainfall(). This will return a Pandas DataFrame containing all rainfall observations associated with Harvey.
#Retrieve storm object
storm = basin.get_storm(('harvey',2017))

#Retrieve storm rainfall
harvey_rain = rain_obj.get_storm_rainfall(storm)
Now let’s look through the pandas DataFrame containing Harvey’s rainfall:
harvey_rain
We can use Pandas’ DataFrame utility to rearrange this by the “Total” column (representing rainfall in inches) to see the highest rain total associated with Harvey - which gives us 60.58 inches near Nederland.
harvey_rain.sort_values('Total',ascending=False)
More generically speaking, we can write the code below to retrieve the row with the maximum rainfall for the storm, then retrieve its rain total in inches, station name, and coordinates.
import numpy as np

row = harvey_rain.loc[harvey_rain['Total'] == np.nanmax(harvey_rain['Total'])]

print(f"Max Rainfall = {row['Total'].values[0]} Inches")
print(f"Location = {row['Station'].values[0]}")
print(f"Latitude = {row['Lat'].values[0]}")
print(f"Longitude = {row['Lon'].values[0]}")
Max Rainfall = 60.58 Inches
Location = Nederland 1.5 SW
Latitude = 29.95
Longitude = -94.01
Plotting TC Rainfall
Tropycal provides two methods to plot tropical cyclone rainfall: by grid, or by individual observations.
We’ll start off with plotting gridded rainfall. First we’ll need to interpolate to a cartesian grid using the interpolate_to_grid() method, and retrieve an xarray DataArray of the grid and its associated coordinates. Note that the default is to interpolate to a 0.1 degree grid - you can use the grid_res argument to provide a different resolution.
Next we’ll use the plot_rain_grid() method to plot the output, and provide contour levels for plotting. As Hurricane Harvey was most damaging in Texas, we’ll provide a custom domain zoomed in over Texas.
#Interpolate to grid
grid = rain_obj.interpolate_to_grid(storm,return_xarray=True)

levels = [1,2,4,8,12,16,20,30,40,50,60]
rain_obj.plot_rain_grid(storm,grid,levels,domain={'s':26,'n':39,'w':-103,'e':-82})
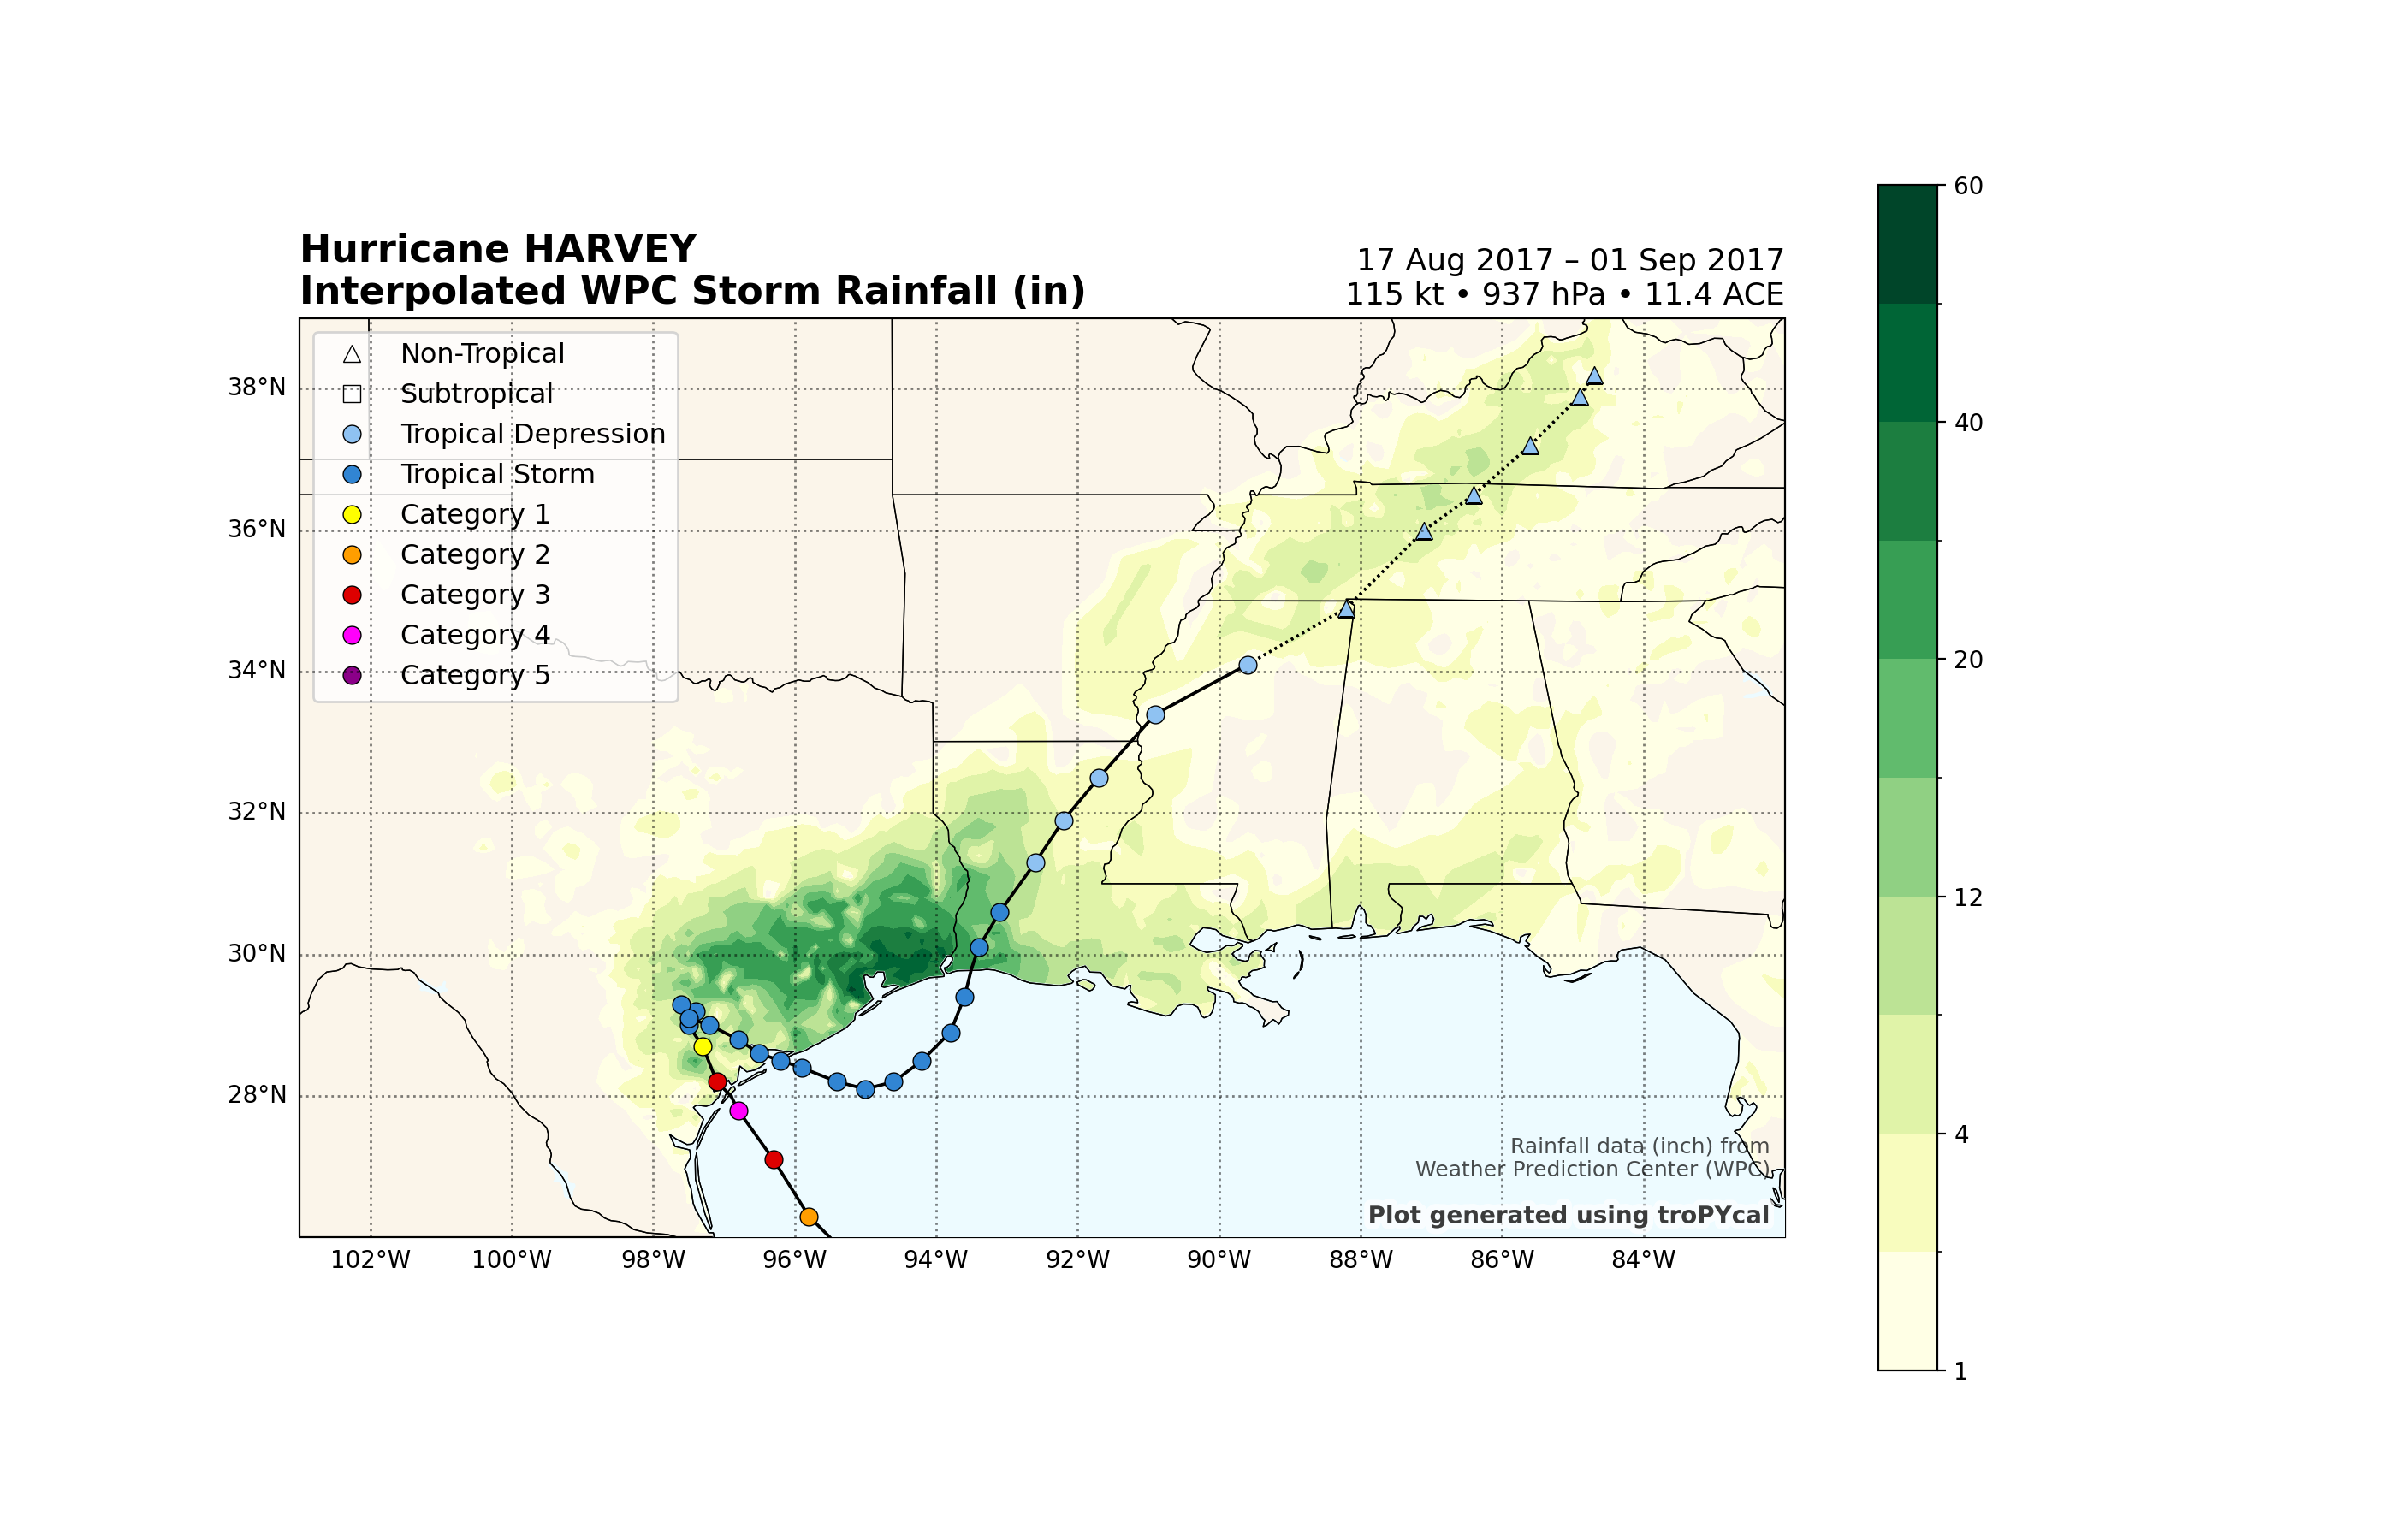
<GeoAxes: title={'left': 'Hurricane HARVEY\nInterpolated WPC Storm Rainfall (in)', 'right': '17 Aug 2017 – 01 Sep 2017\n115 kt • 937 hPa • 11.4 ACE'}>
Linear interpolation isn’t perfect of course, especially considering that some observations in this dataset aren’t perfectly quality controlled.
To compensate, we can also plot the individual rain observation dots using the plot_rain() method:
levels = [1,2,4,8,12,16,20,30,40,50,60]
rain_obj.plot_rain(storm,levels=levels,domain={'s':26,'n':39,'w':-103,'e':-82})
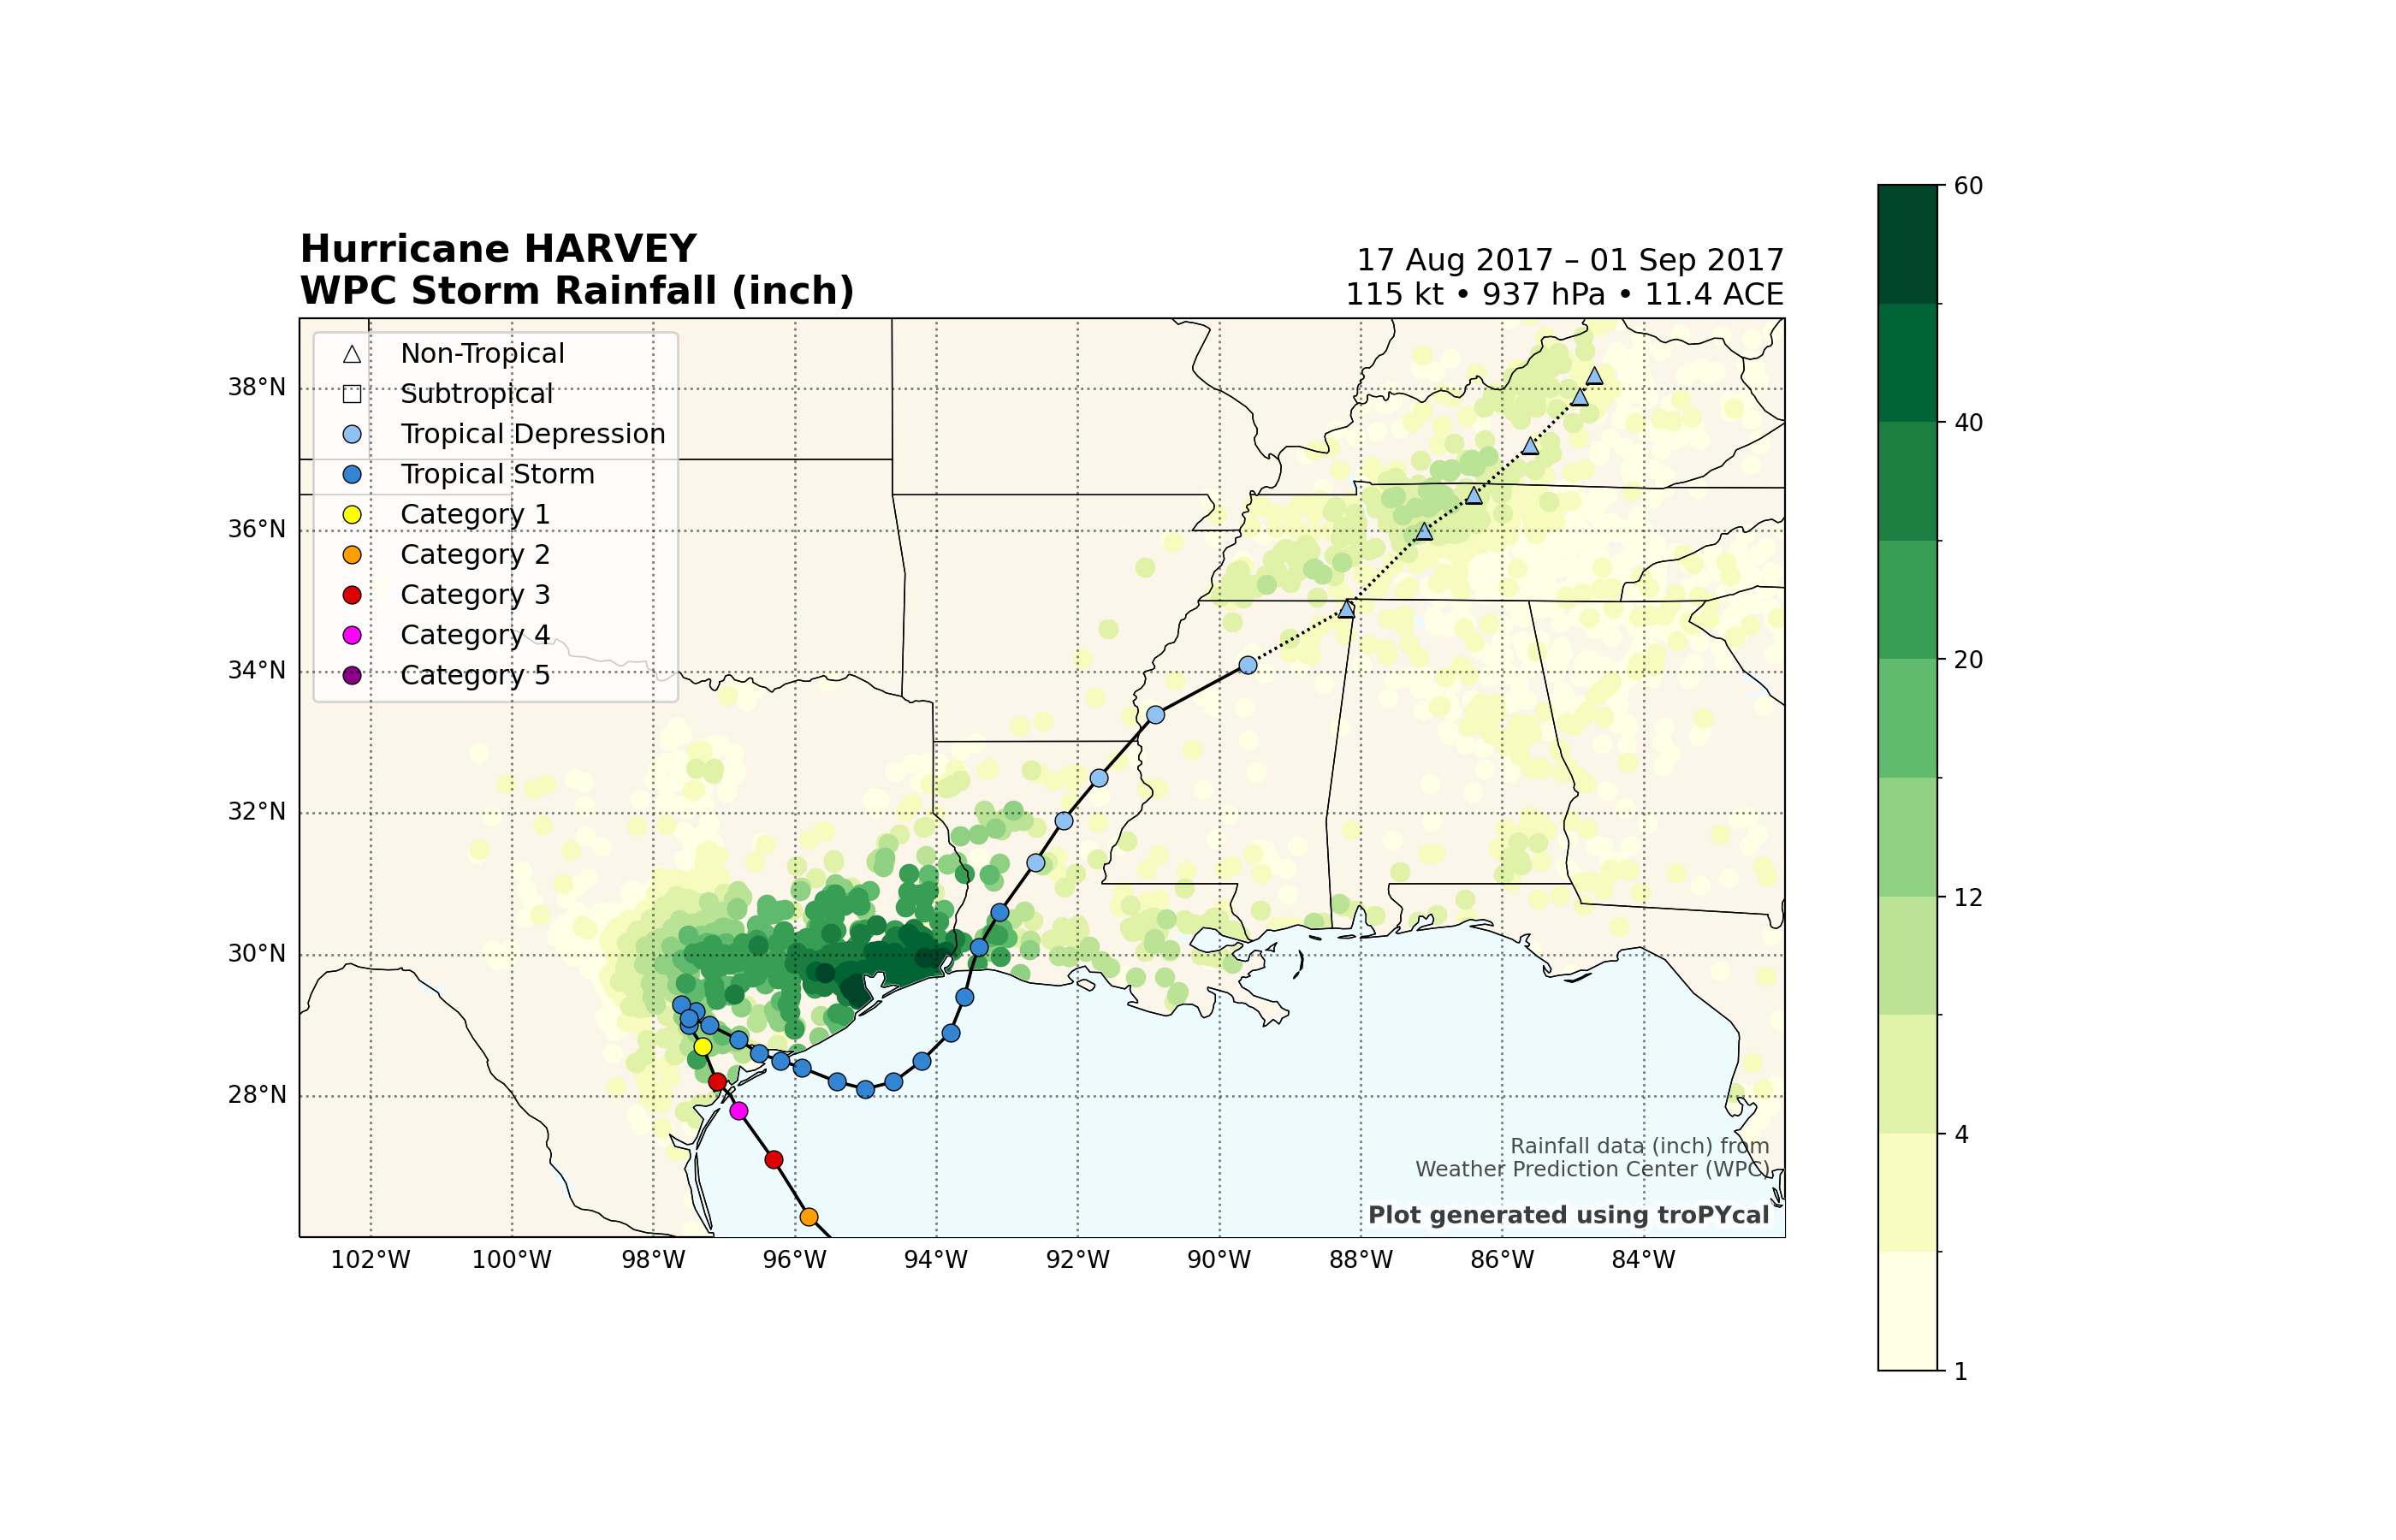
<GeoAxes: title={'left': 'Hurricane HARVEY\nWPC Storm Rainfall (inch)', 'right': '17 Aug 2017 – 01 Sep 2017\n115 kt • 937 hPa • 11.4 ACE'}>
The Houston, Texas metro was particularly hard-hit by Hurricane Harvey, with rain totals over 30 inches in many locations.
Let’s filter the plot to only rain observations over 30 inches to highlight this, while zooming in closer over Houston:
levels = [1,2,4,8,12,16,20,30,40,50,60]
rain_obj.plot_rain(storm,levels=levels,minimum_threshold=30,domain={'s':27,'n':32,'w':-99,'e':-92})
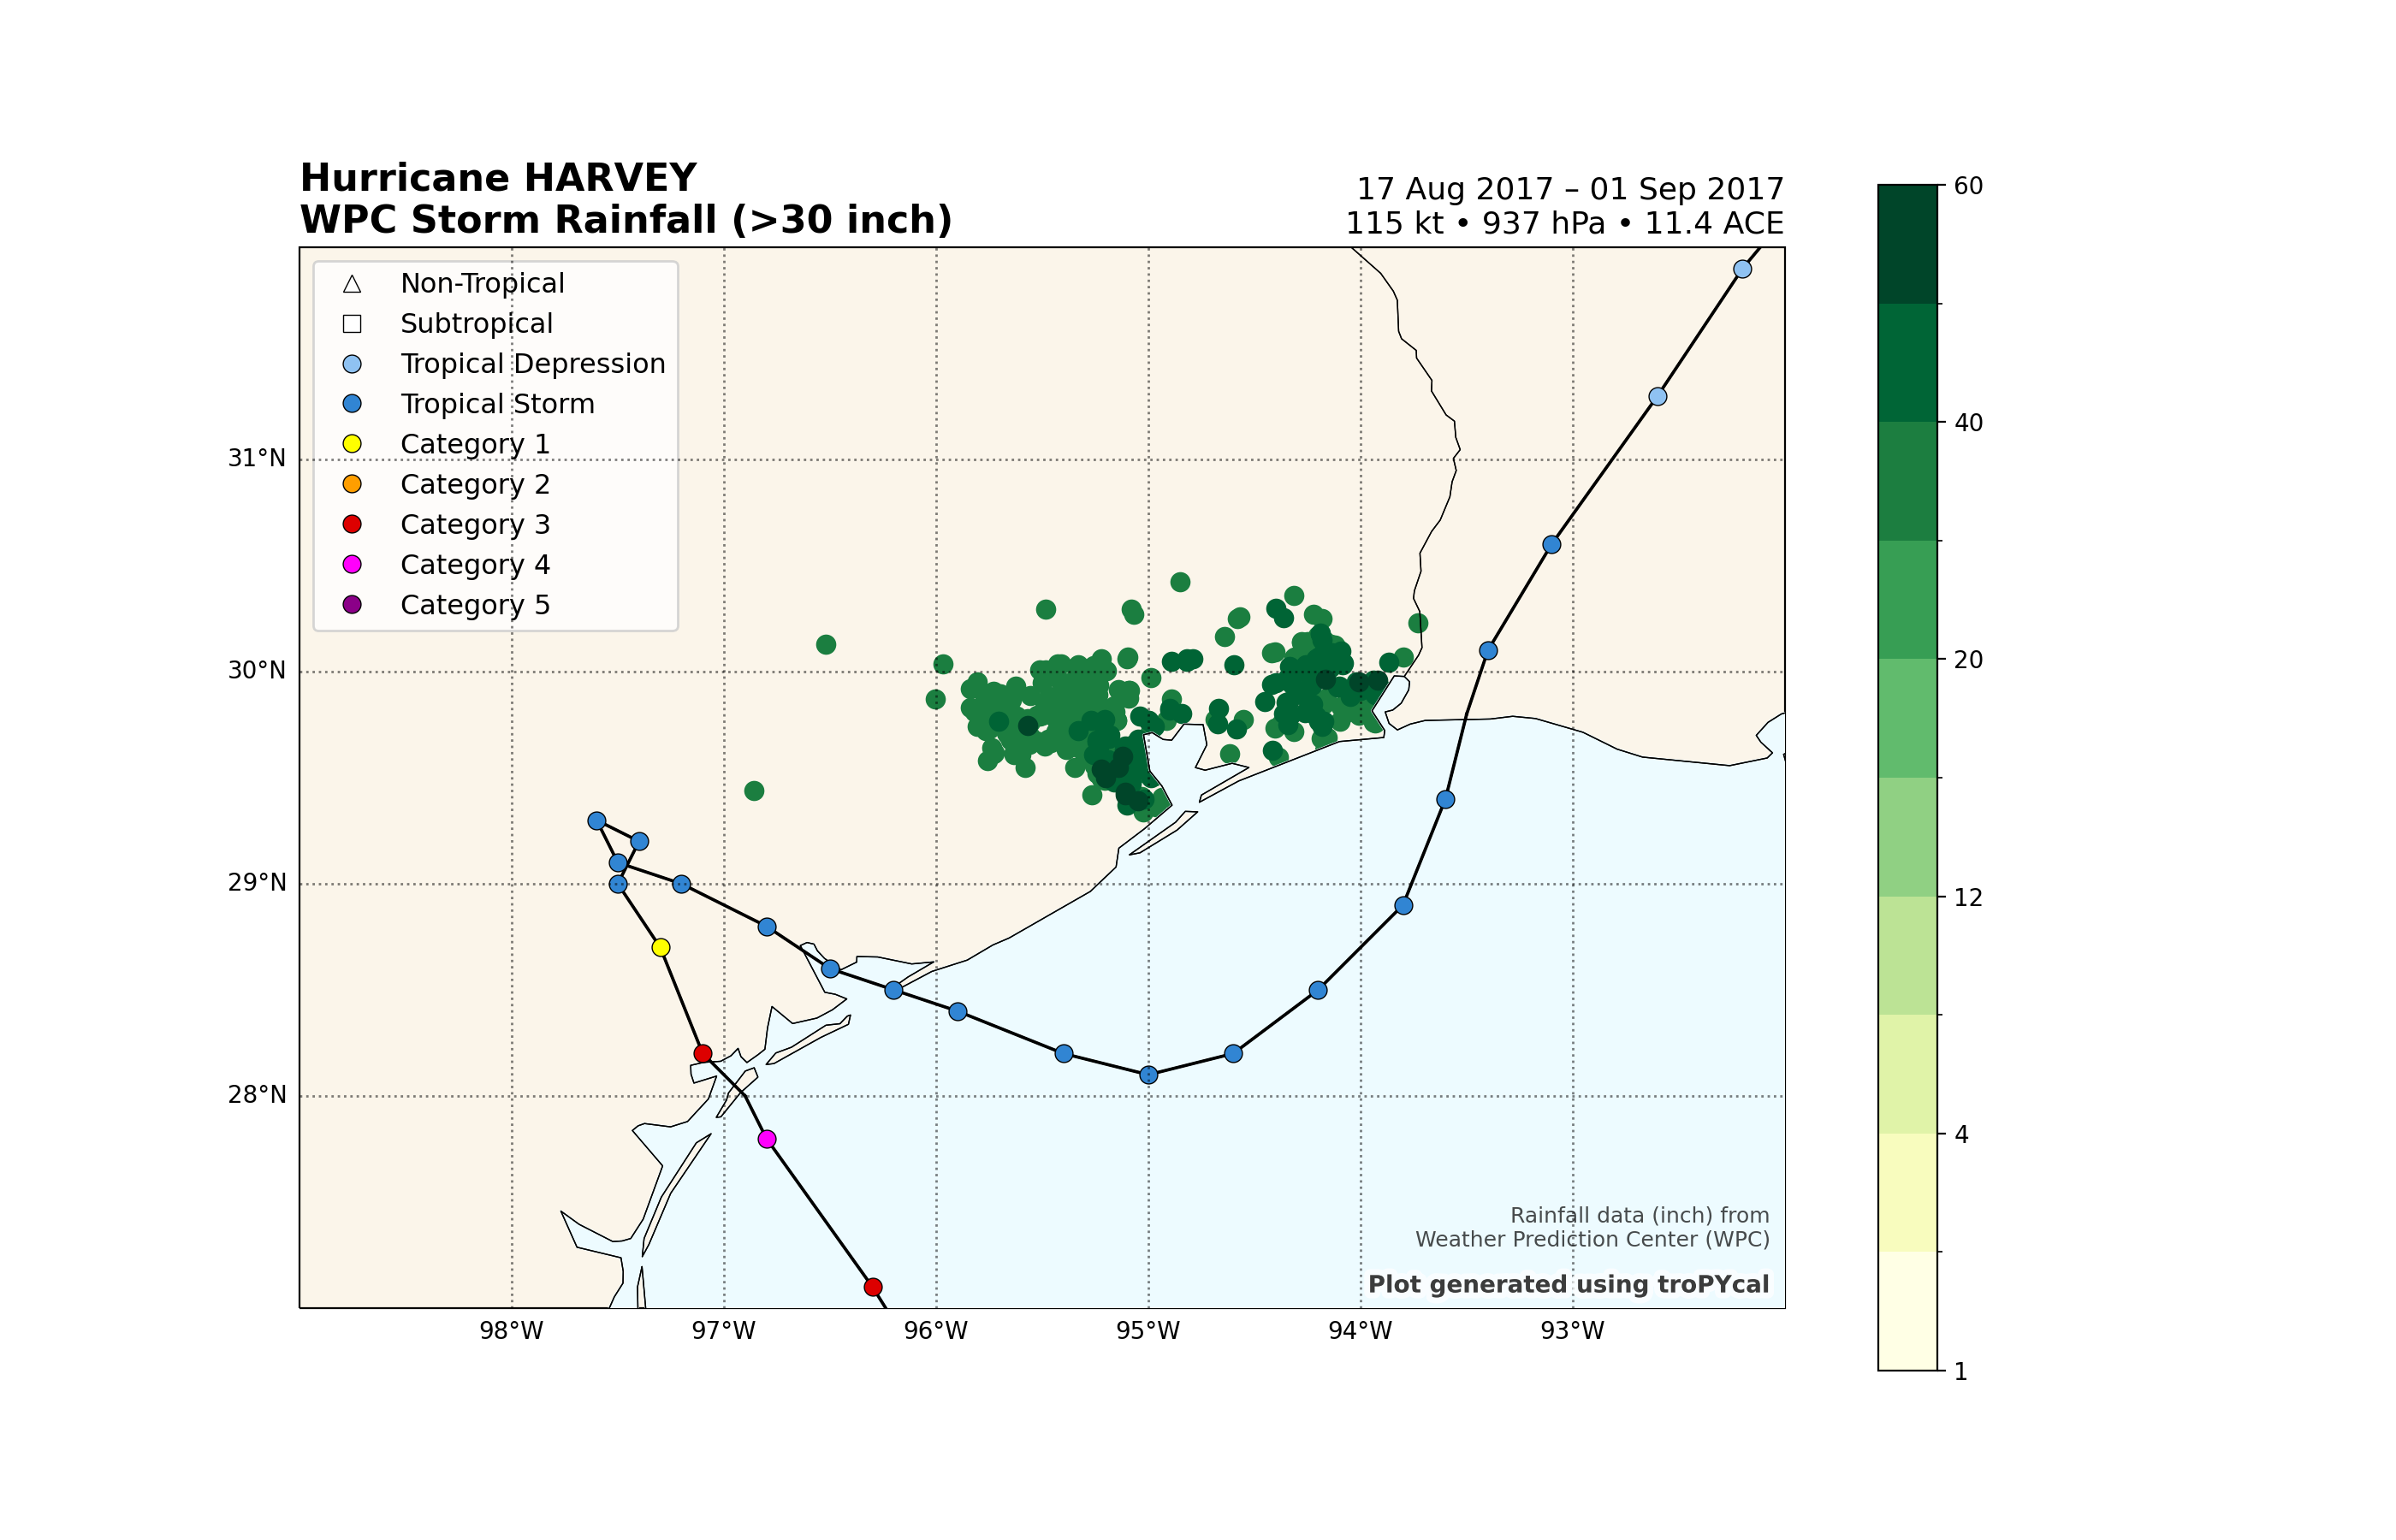
<GeoAxes: title={'left': 'Hurricane HARVEY\nWPC Storm Rainfall (>30 inch)', 'right': '17 Aug 2017 – 01 Sep 2017\n115 kt • 937 hPa • 11.4 ACE'}>
Total running time of the script: ( 0 minutes 18.383 seconds)