Note
Go to the end to download the full example code
Aircraft Recon Data Analysis
This sample script shows how to use Tropycal to retrieve, analyze and plot aircraft reconnaissance missions.
from tropycal import tracks, recon
import numpy as np
import datetime as dt
Reading In Recon Dataset
There are several ways of retrieving a ReconDataset object. The first step is to retrieve a TrackDataset object, which for this example we’ll use the HURDATv2 database for the North Atlantic basin.
basin = tracks.TrackDataset('north_atlantic')
--> Starting to read in HURDAT2 data
--> Completed reading in HURDAT2 data (1.99 seconds)
We’ll now retrieve a Storm object for Hurricane Irma (2017), which will be used for this example code.
storm = basin.get_storm(('Irma',2017))
Now that we have a Storm object, there are several ways of retrieving recon data.
The first and easiest way is through the Storm object, which already contains an empty instance of ReconDataset stored as an attribute
storm.recon. This method will be highlighted in this script. Its methods can then be accessed asstorm.recon.plot_summary(), for example.The second method is through retrieving an instance of ReconDataset, providing the storm object as an argument (e.g.,
recon_obj = recon.ReconDataset(storm)). Its methods can then be accessed asrecon_obj.plot_summary(), for example.The individual sub-classes (to be discussed later) can also be created individually of a ReconDataset object, providing the storm object as an argument (e.g.,
dropsondes = recon.dropsondes(storm)).
For the rest of this script, we’ll be using the first method.
Recon Sub-Classes
The three primary sub-classes of the recon module are:
Class |
Description |
|---|---|
hdobs |
Class containing all High Density Observations (HDOBs) for this Storm. |
dropsondes |
Class containing all dropsondes for this Storm. |
vdms |
Class containing all Vortex Data Messages (VDMs) for this Storm. |
The following functionality is used to retrieve data for each sub-class. Each class has a to_pickle() method, which can be used to save the data once it’s been read in as a local pickle file, which can be re-read in later.
storm.recon.get_vdms()
#Save pickle file of VDM data (list of dictionaries)
storm.recon.vdms.to_pickle(f'{storm.name}{storm.year}_vdms.pickle')

storm.recon.get_dropsondes()
#Save pickle file of Dropsonde data (list of dictionaries)
storm.recon.dropsondes.to_pickle(f'{storm.name}{storm.year}_dropsondes.pickle')

storm.recon.get_hdobs()
#Save pickle file of HDOB data (Pandas dataframe)
storm.recon.hdobs.to_pickle(f'{storm.name}{storm.year}_hdobs.pickle')
Searching through recon VDM files between 20170830 and 20170913 ...
--> Completed reading in recon VDM files (17.0 seconds)
Read 82 files
Searching through recon dropsonde files between 201708290000 and 201709141200 ...
--> Completed reading in recon dropsonde files (85.4 seconds)
Read 460 files
Searching through recon HDOB files between 20170829 and 20170914 ...
--> Completed reading in recon HDOB files (325.7 seconds)
Read 1491 files
Unable to decode 0 files
These can be initialized again any time later with the saved pickle files:
>>> storm.recon.get_vdms(f'{storm.name}{storm.year}_vdms.pickle')
>>> storm.recon.get_dropsondes(f'{storm.name}{storm.year}_dropsondes.pickle')
>>> storm.recon.get_hdobs(f'{storm.name}{storm.year}_hdobs.pickle')
Visualizing ReconDataset
Print the recon object to see a summary of the data in recon from the three objects:
<tropycal.recon.hdobs>
Dataset Summary:
    Storm:                        IRMA 2017
    Missions:                     31
    Time range:                   Sep-03 19:11 — Sep-10 22:37
    Max 30sec flight level wind:  162.0 knots
    Max 10sec flight level wind:  167.0 knots
    Max SFMR wind:                172.0 knots
    Min surface pressure:         909.1 hPa
    Source:                       National Hurricane Center (NHC)
<tropycal.recon.dropsondes>
Dataset Summary:
    Storm:                   IRMA 2017
    Missions:                31
    Dropsondes:              458
    Max 500m-avg wind:       170.0 knots
    Max 150m-avg wind:       163.0 knots
    Min sea level pressure:  915.0 hPa
    Source:                  National Hurricane Center (NHC)
<tropycal.recon.vdms>
Dataset Summary:
    Storm:                   IRMA 2017
    Missions:                23
    VDMs:                    82
    Min sea level pressure:  915.0 hPa
    Source:                  National Hurricane Center (NHC)
A summary of recon data for this storm can also be plotted:
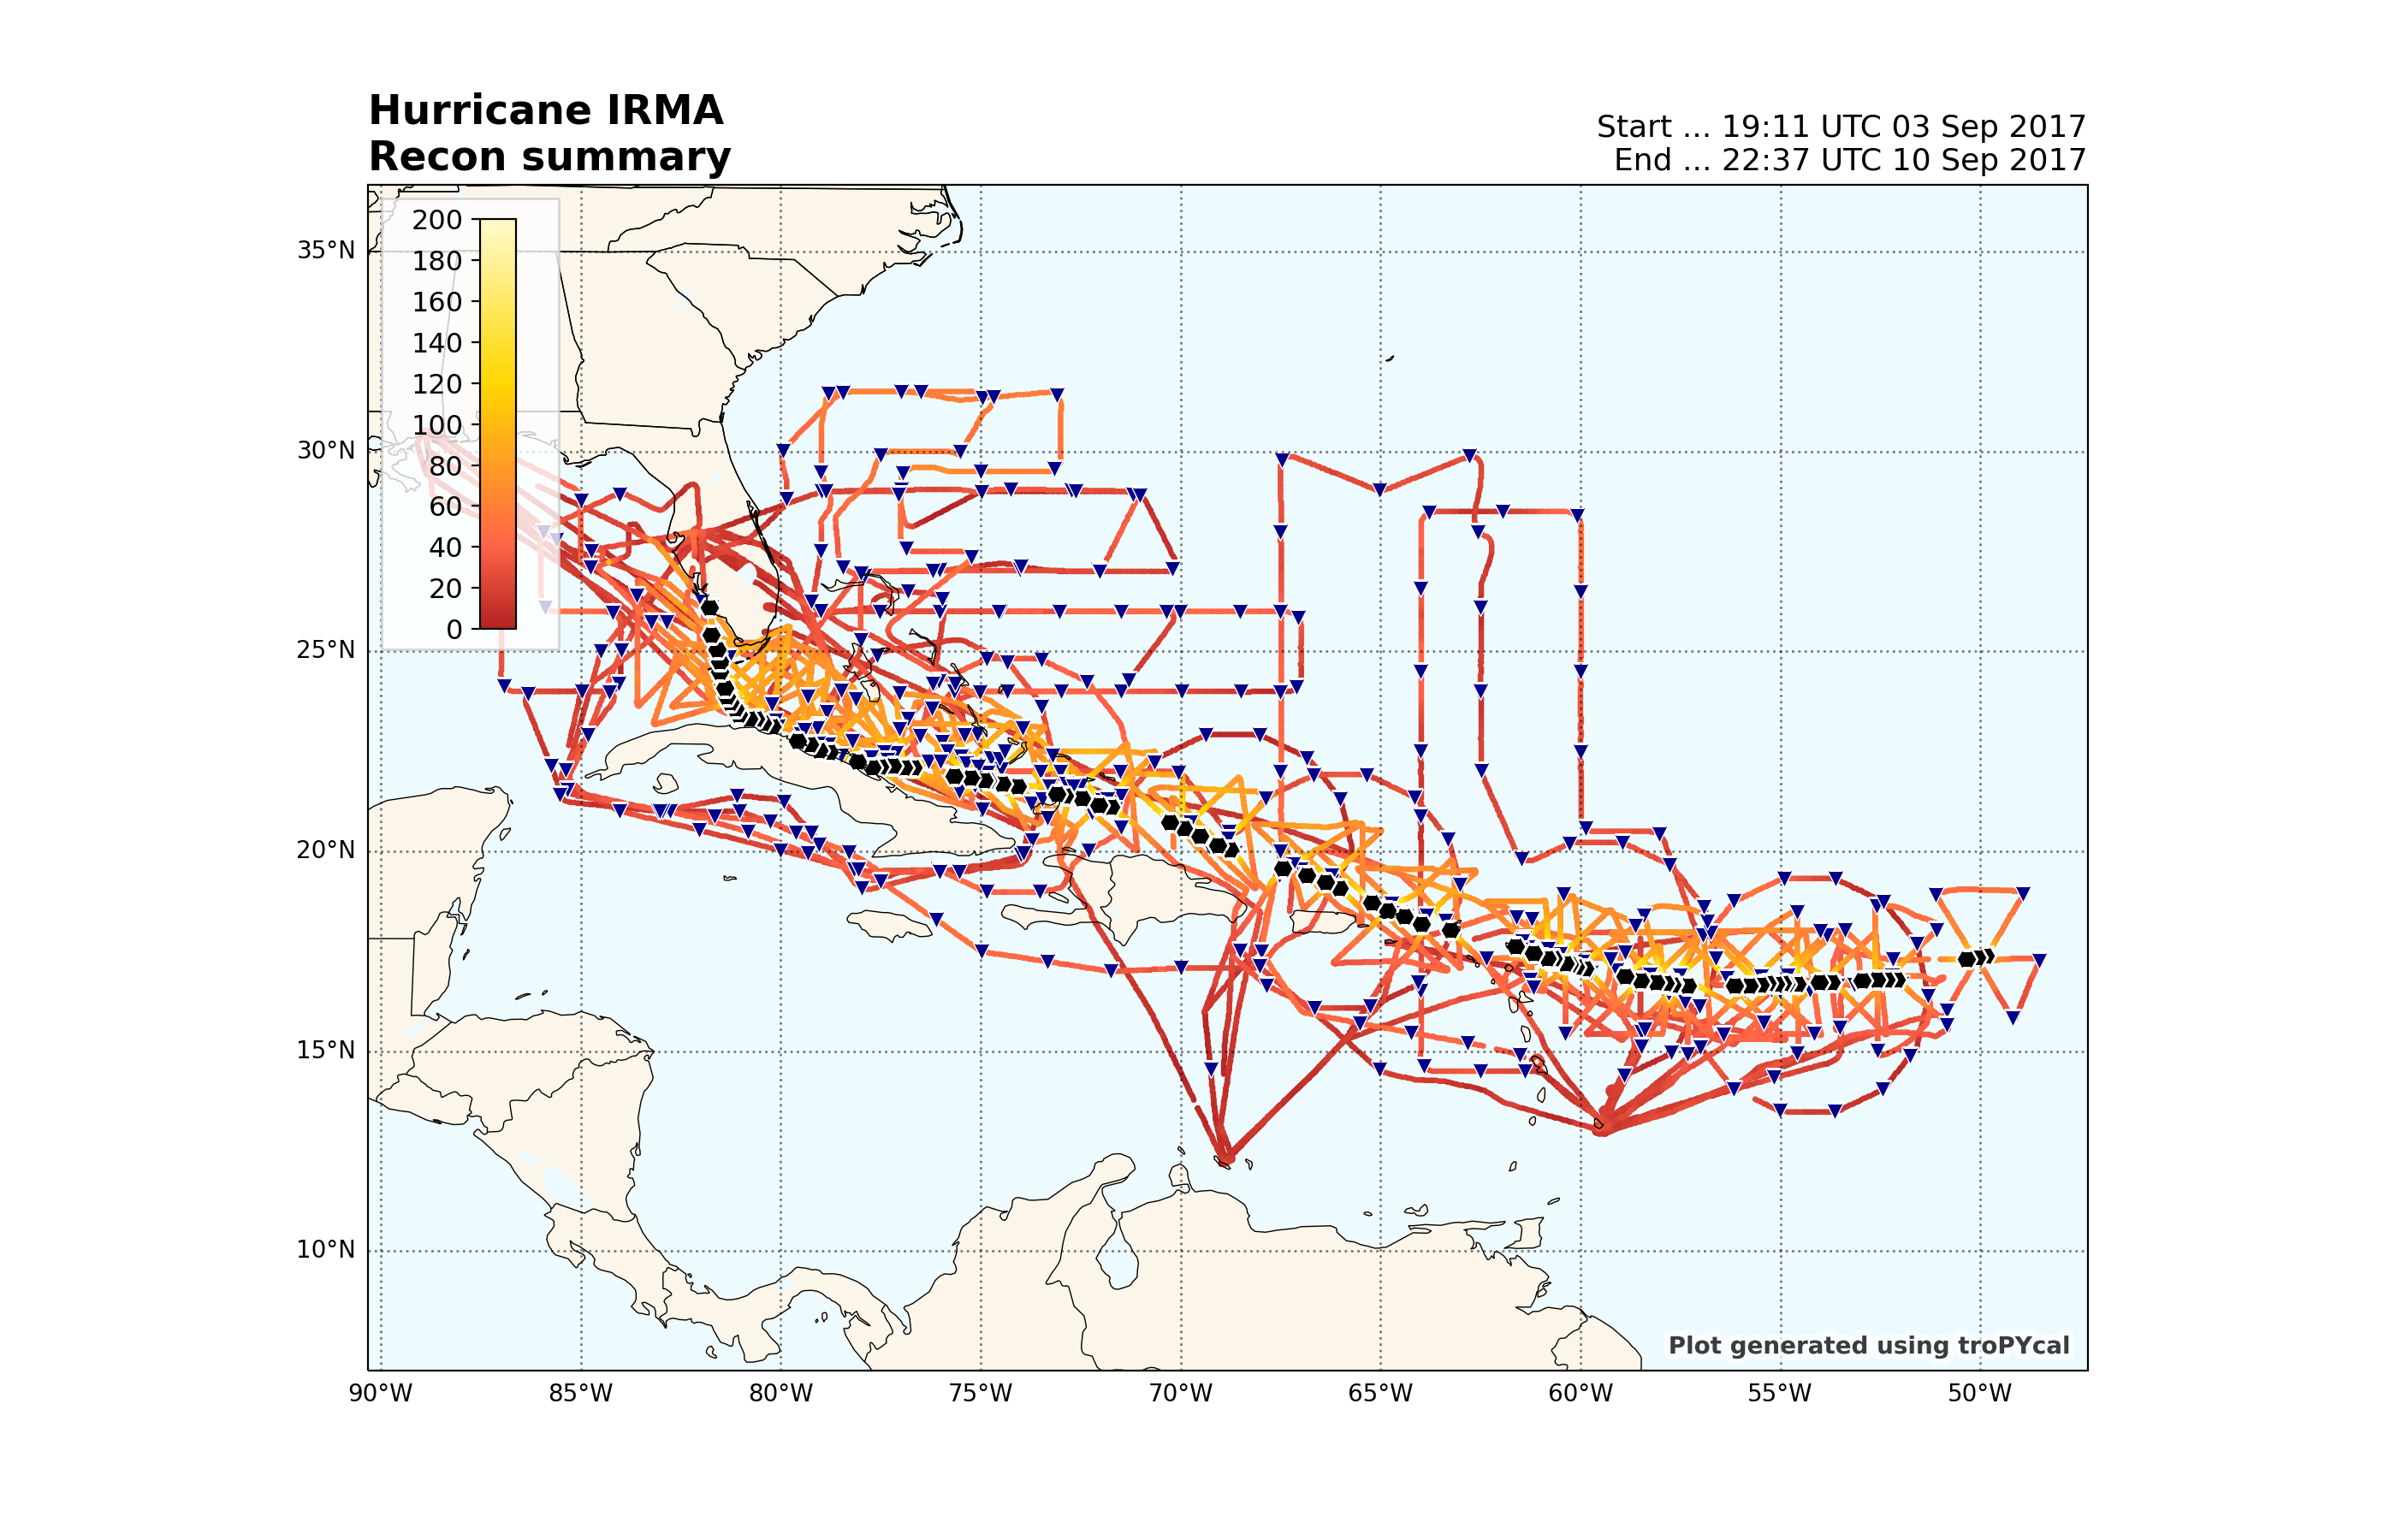
<GeoAxes: title={'left': 'Hurricane IRMA\nRecon summary', 'right': 'Start ... 19:11 UTC 03 Sep 2017\nEnd ... 22:37 UTC 10 Sep 2017'}>
Find the mission numbers that were active during a given time, within a distance (in km) from the storm:
storm.recon.find_mission(dt.datetime(2017,9,7,12), distance=200)
['17']
Then plot a summary from just that mission:
storm.recon.plot_summary(mission=17)
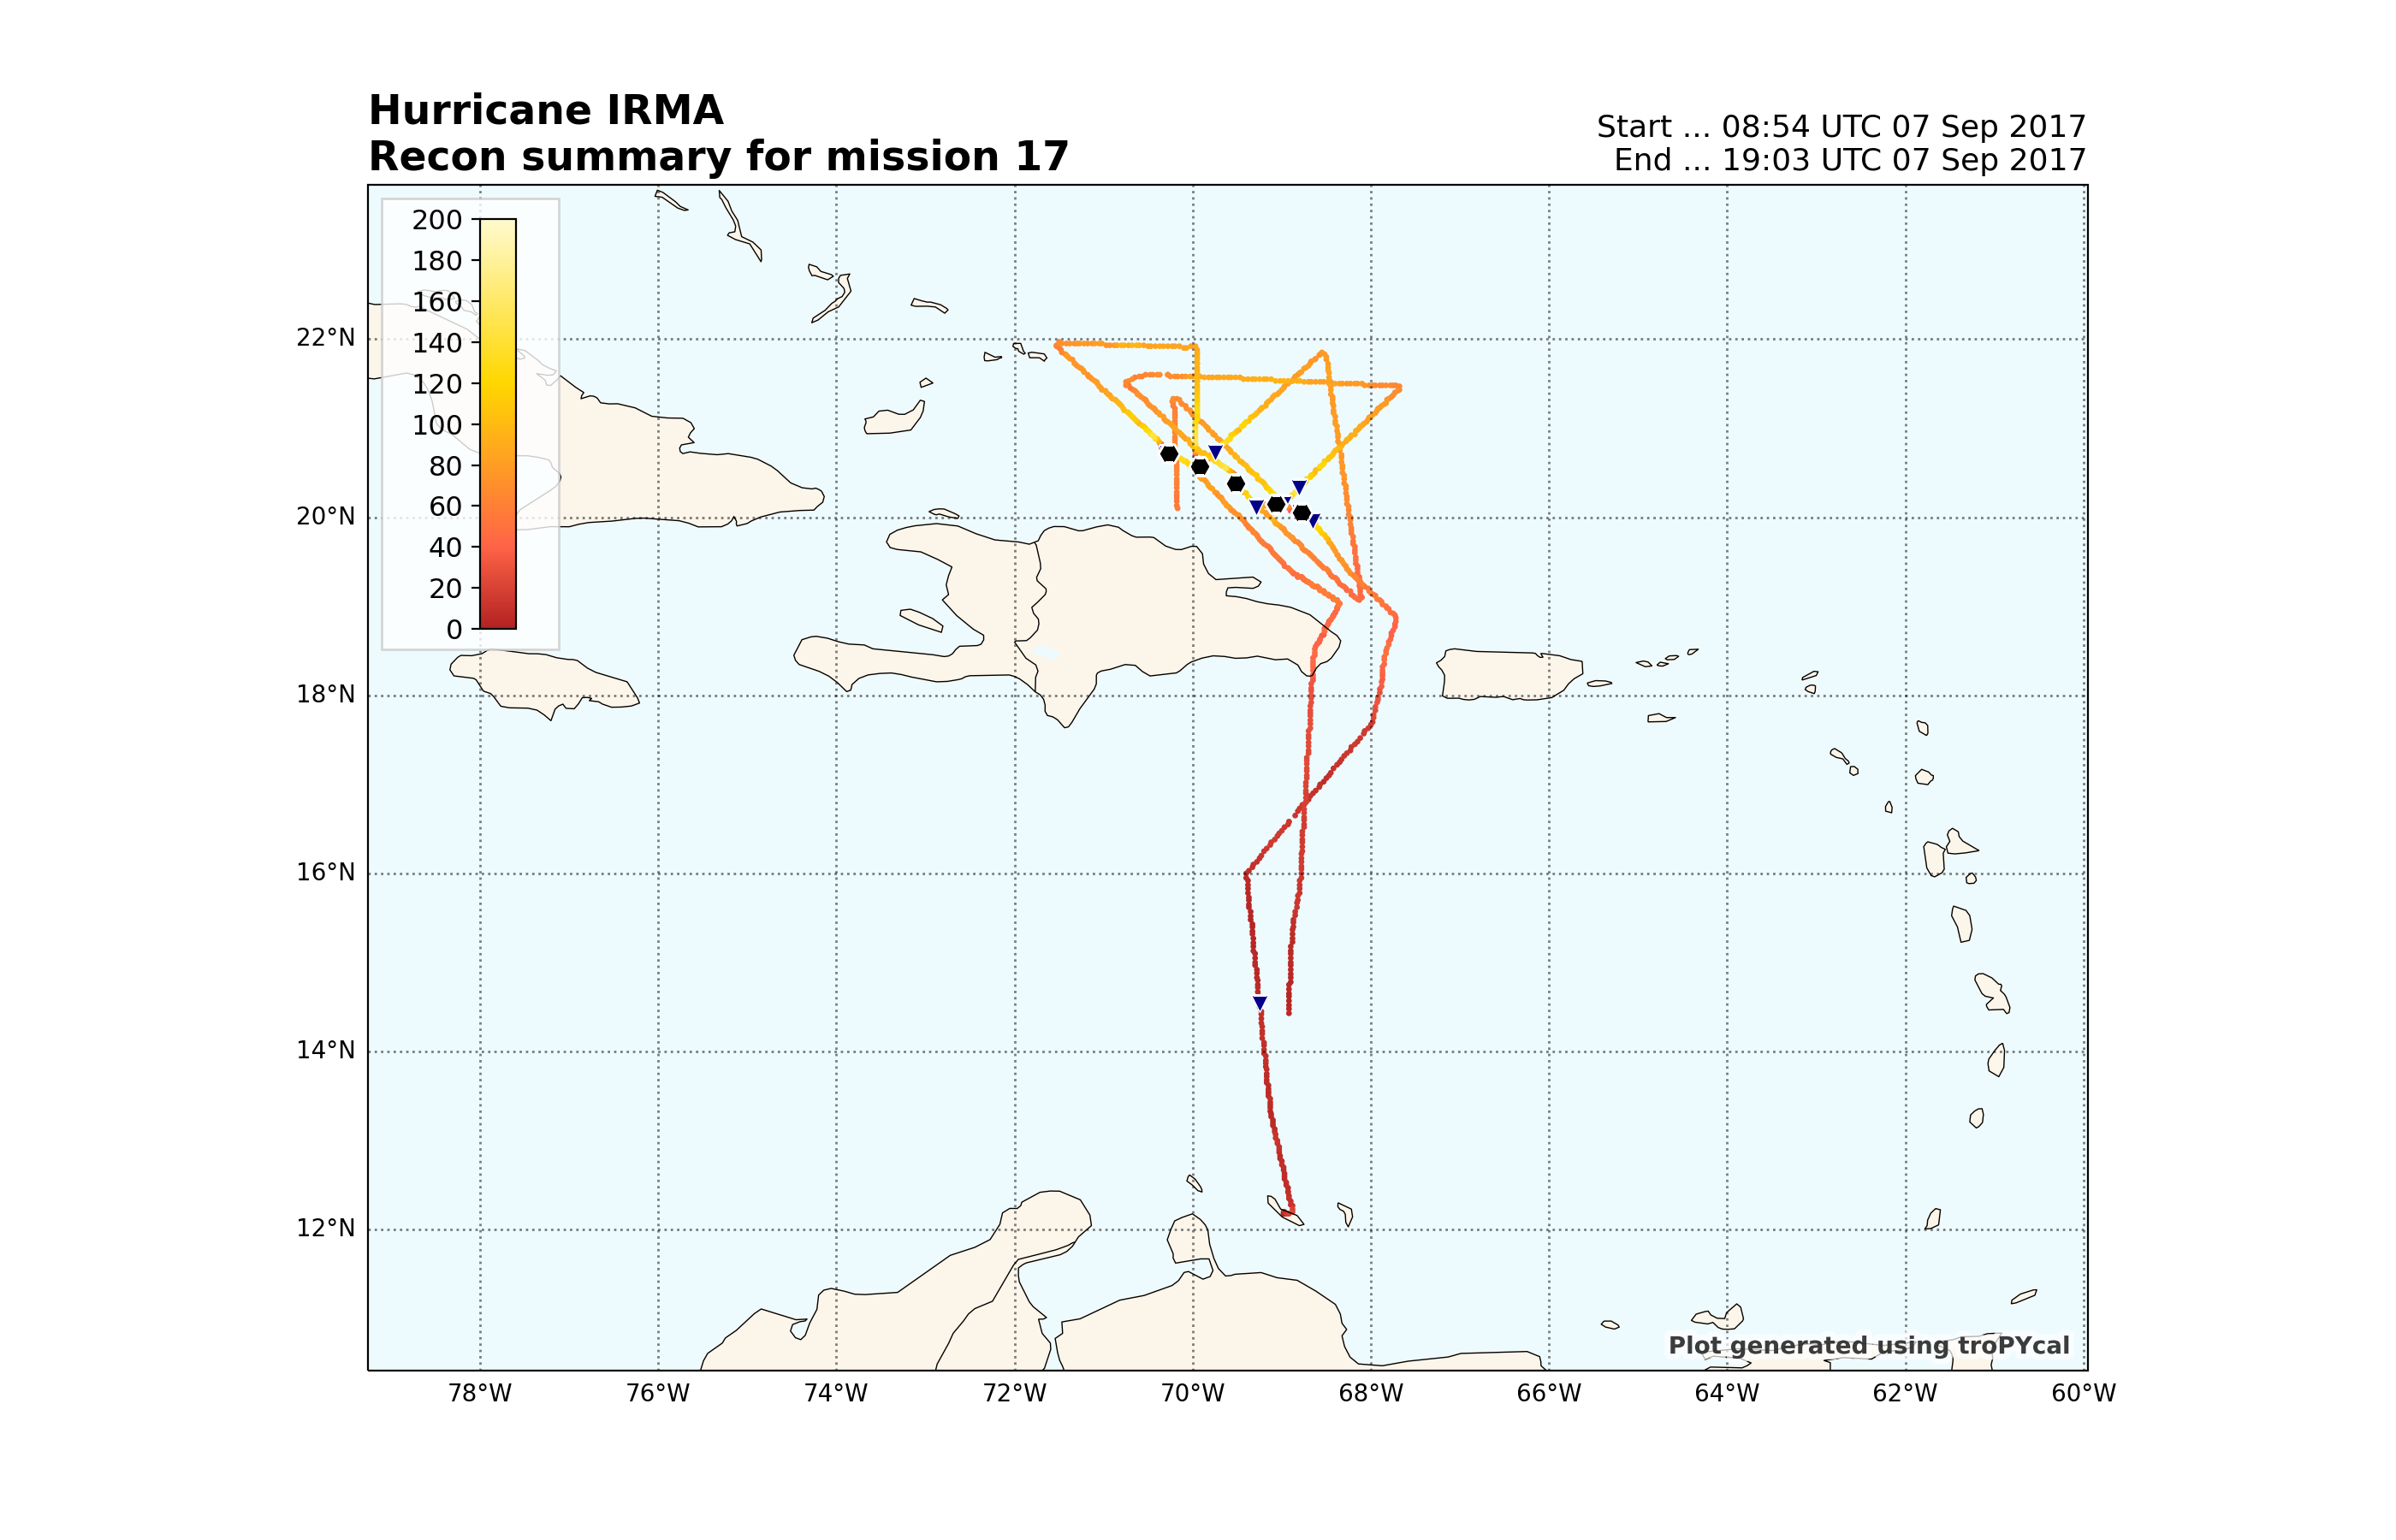
<GeoAxes: title={'left': 'Hurricane IRMA\nRecon summary for mission 17', 'right': 'Start ... 08:54 UTC 07 Sep 2017\nEnd ... 19:03 UTC 07 Sep 2017'}>
High Density Observations (HDOBs)
The first class we’ll be reviewing is the HDOBs class, which is the largest containing the most data given the high frequency of observations. Let’s start by viewing the HDOB summary:
<tropycal.recon.hdobs>
Dataset Summary:
    Storm:                        IRMA 2017
    Missions:                     31
    Time range:                   Sep-03 19:11 — Sep-10 22:37
    Max 30sec flight level wind:  162.0 knots
    Max 10sec flight level wind:  167.0 knots
    Max SFMR wind:                172.0 knots
    Min surface pressure:         909.1 hPa
    Source:                       National Hurricane Center (NHC)
And view HDOB Pandas DataFrame data:
storm.recon.hdobs.data
Plot a summary of the recon data for this storm, using peak wind gusts with a custom colormap:
storm.recon.hdobs.plot_points('pkwnd',prop={'cmap':{1:'dodgerblue',2:'gold',3:'firebrick'},'levels':np.arange(20,161,10)})
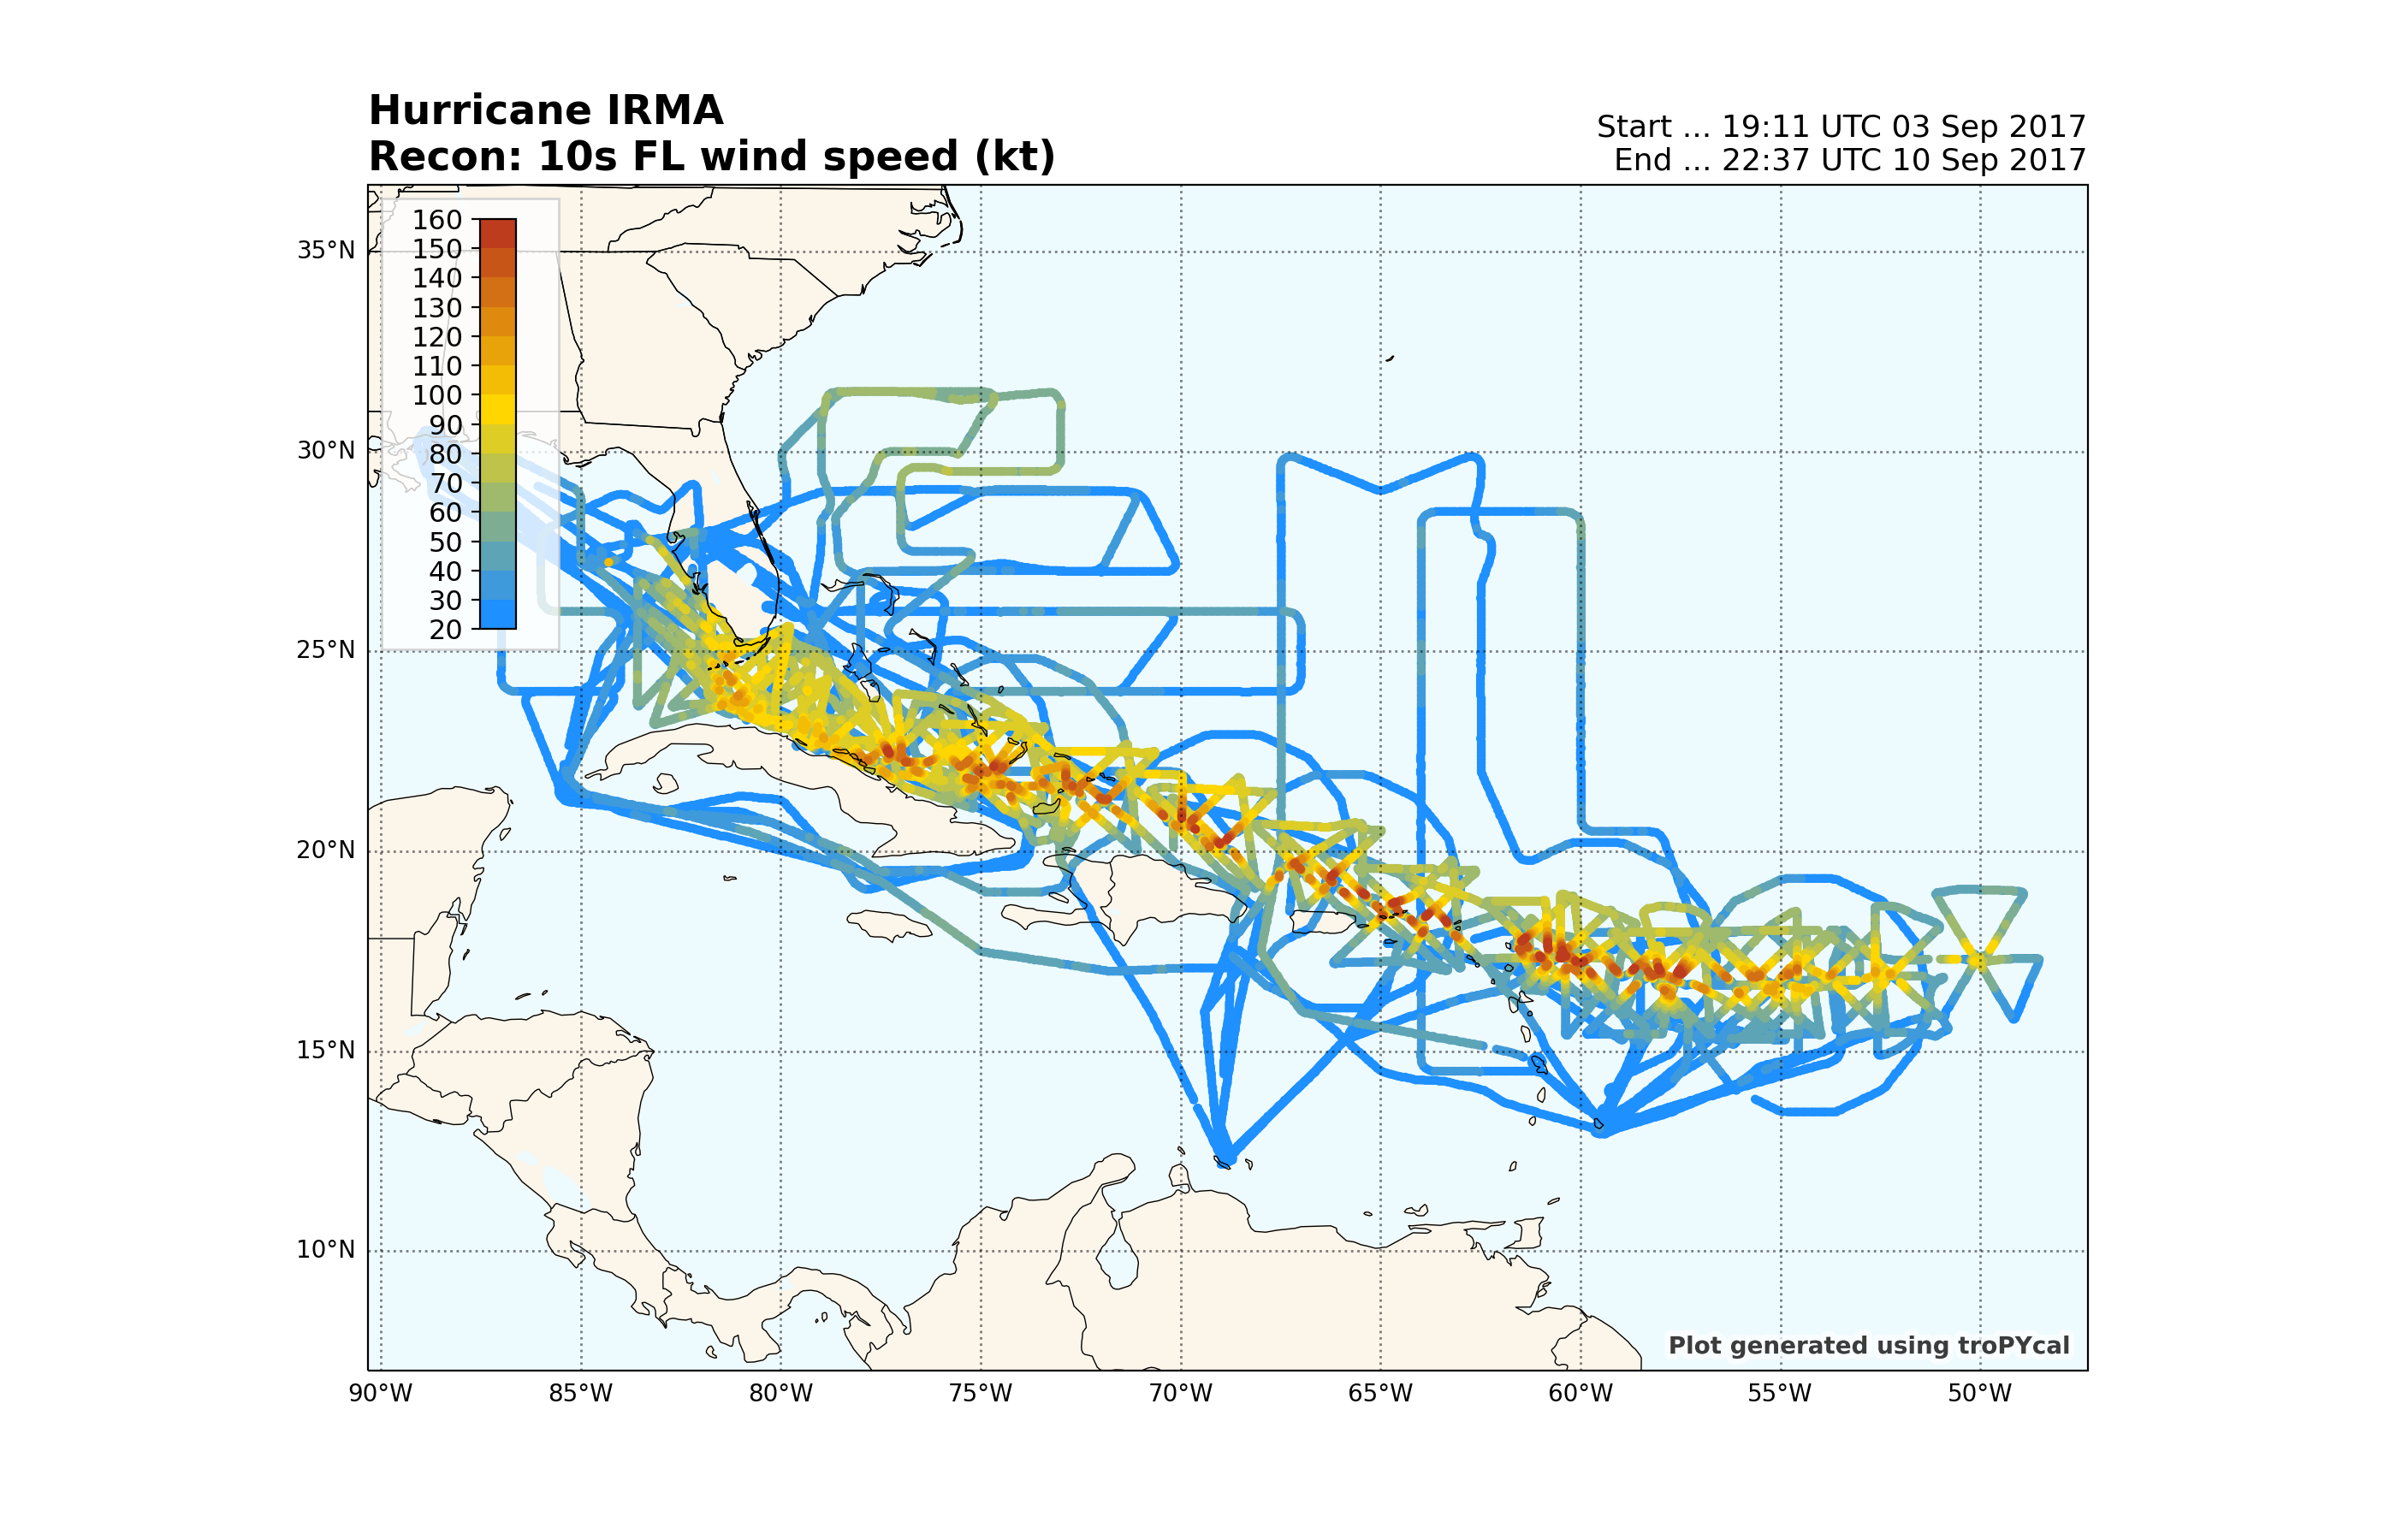
<GeoAxes: title={'left': 'Hurricane IRMA\nRecon: 10s FL wind speed (kt)', 'right': 'Start ... 19:11 UTC 03 Sep 2017\nEnd ... 22:37 UTC 10 Sep 2017'}>
Plot a hovmoller from recon data interpolated to time and radius - note the eyewall replacement cycles:
storm.recon.hdobs.plot_hovmoller(varname='pkwnd',prop={'cmap':{1:'dodgerblue',2:'gold',3:'firebrick'},'levels':np.arange(20,161,10)})
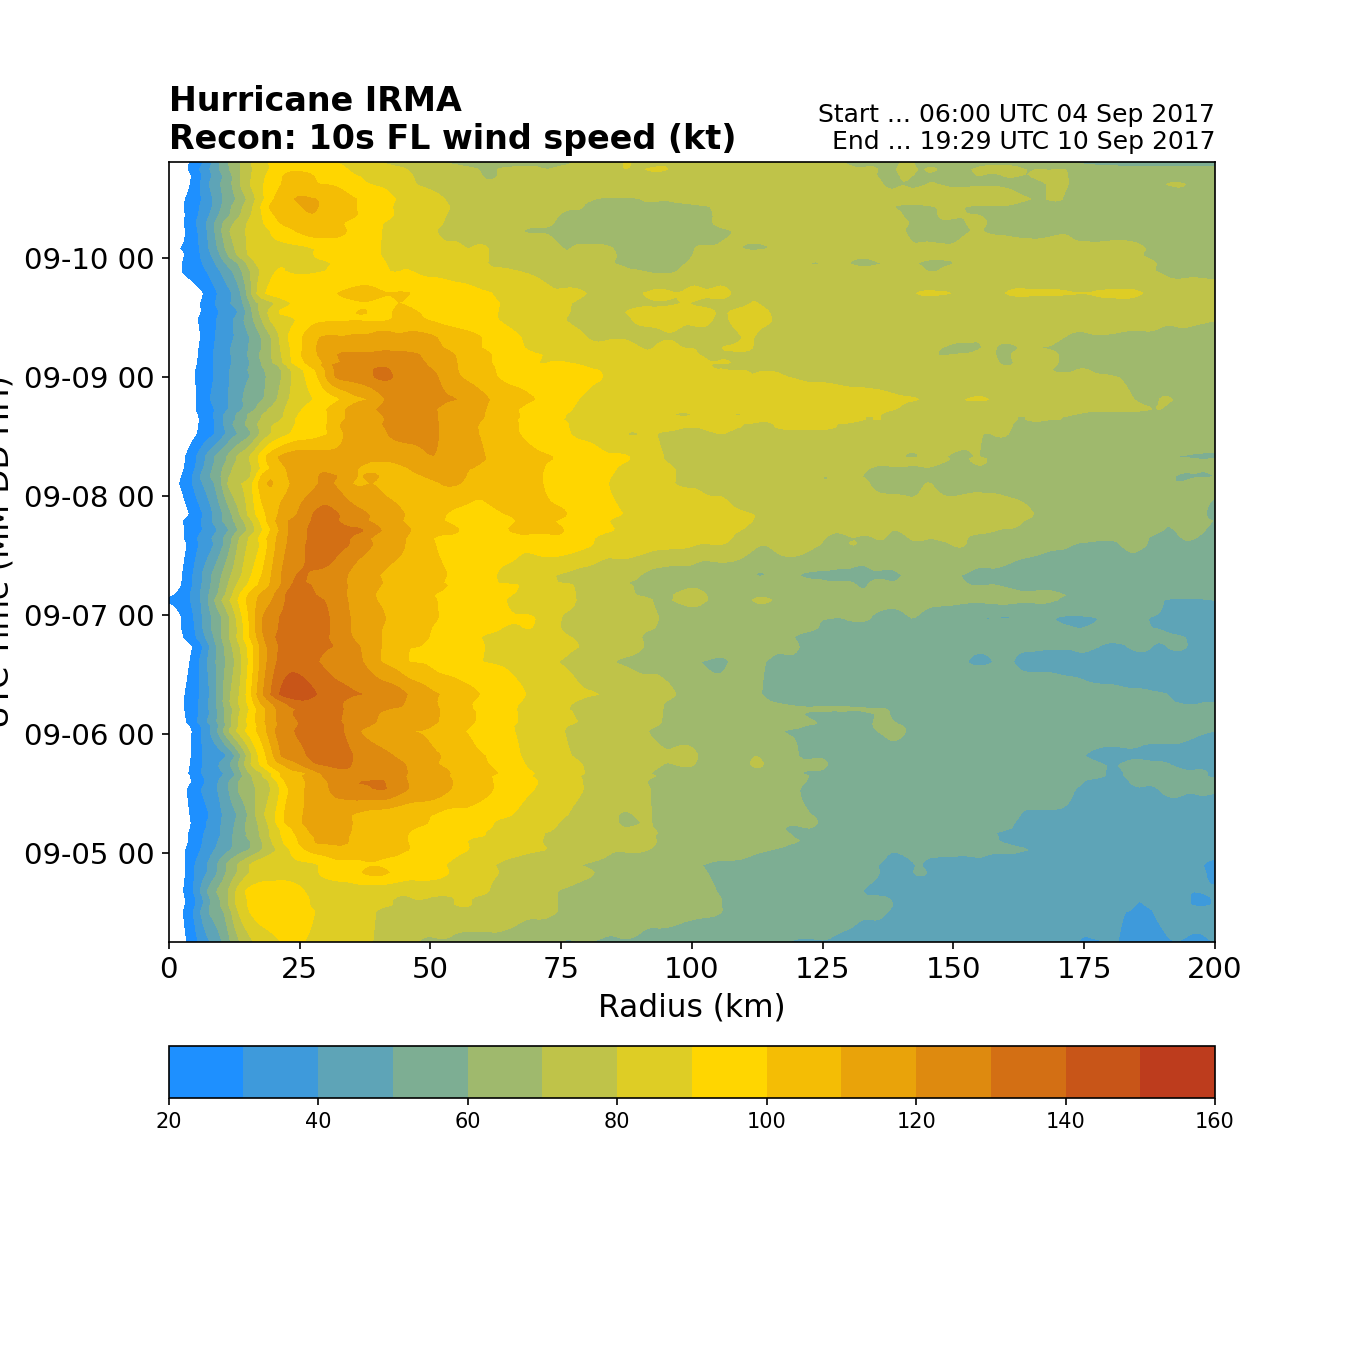
--> Starting interpolation
--> Completed interpolation (34.38 seconds)

<Axes: title={'left': 'Hurricane IRMA\nRecon: 10s FL wind speed (kt)', 'right': 'Start ... 06:00 UTC 04 Sep 2017\nEnd ... 19:29 UTC 10 Sep 2017'}, xlabel='Radius (km)', ylabel='UTC Time (MM-DD HH)'>
Plot a map valid at 1200 UTC 6 September 2017 interpolated to time and space:
time = dt.datetime(2017,9,6,12)
storm.recon.hdobs.plot_maps(time=time,varname='pkwnd',prop={'cmap':{1:'dodgerblue',2:'gold',3:'firebrick'},'levels':np.arange(20,161,10)})
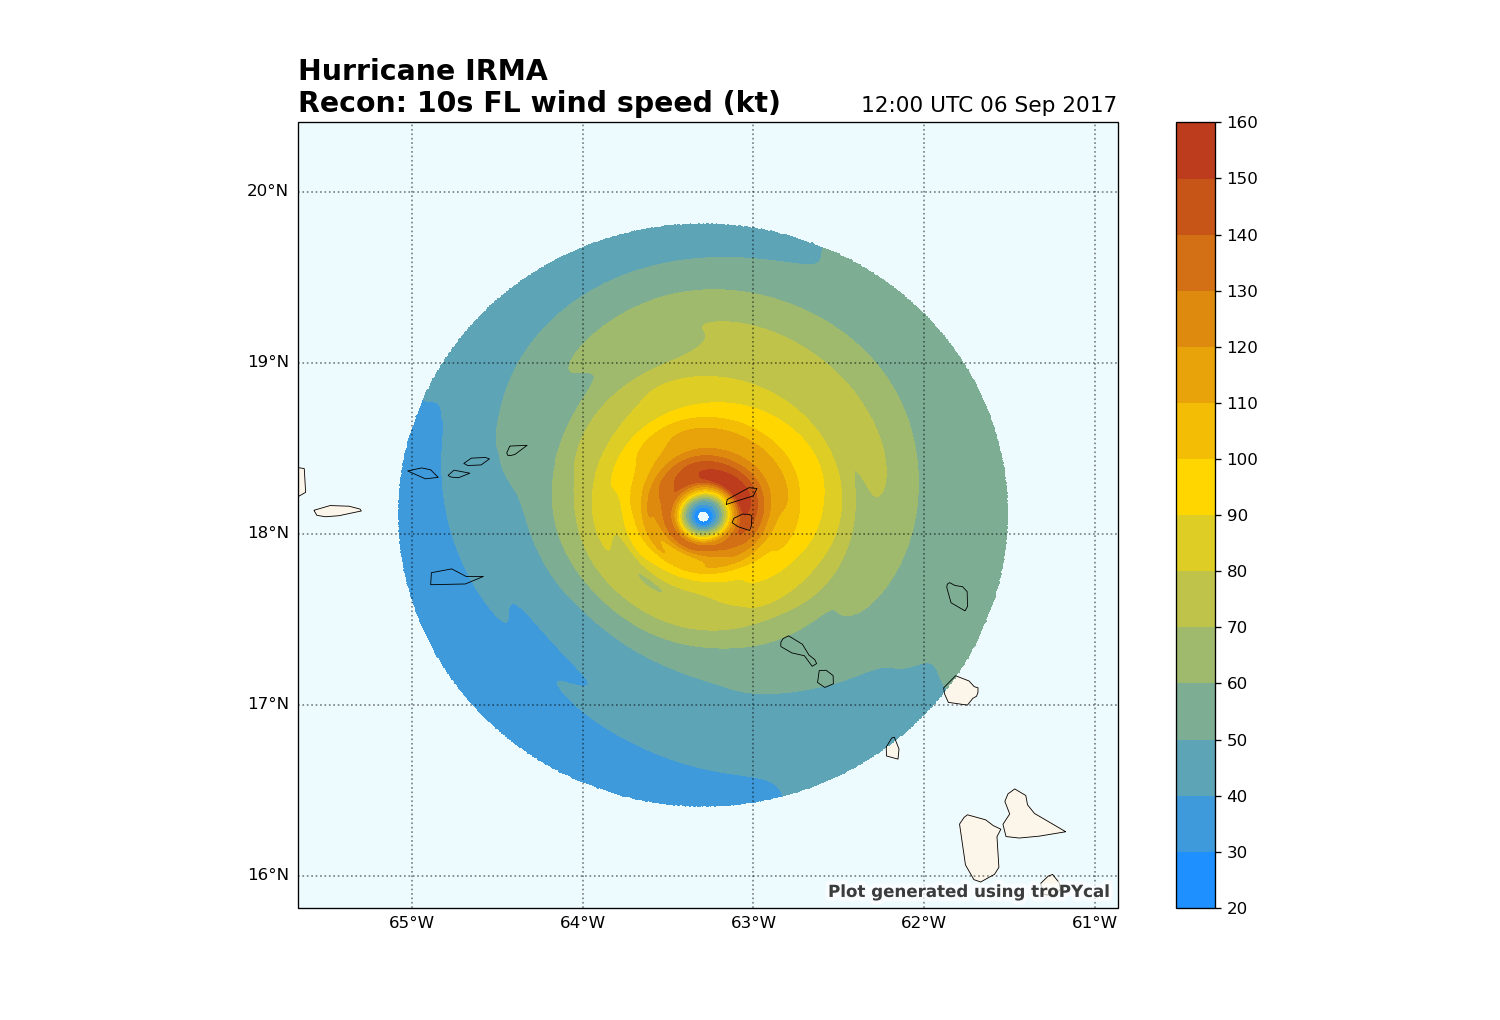
--> Starting interpolation
2017-09-06 12:00:00
--> Completed interpolation (11.83 seconds)

<GeoAxes: title={'left': 'Hurricane IRMA\nRecon: 10s FL wind speed (kt)', 'right': '12:00 UTC 06 Sep 2017'}>
Dropsonde Data
Next we’ll take a look at the dropsonde data for Hurricane Irma. First, let’s take a look at the dropsonde summary:
<tropycal.recon.dropsondes>
Dataset Summary:
    Storm:                   IRMA 2017
    Missions:                31
    Dropsondes:              458
    Max 500m-avg wind:       170.0 knots
    Max 150m-avg wind:       163.0 knots
    Min sea level pressure:  915.0 hPa
    Source:                  National Hurricane Center (NHC)
Now use the sel function to subset to only dropsondes released in the eyewall:
storm.recon.dropsondes.sel(location='eyewall')
<tropycal.recon.dropsondes>
Dataset Summary:
    Storm:                   IRMA 2017
    Missions:                19
    Dropsondes:              73
    Max 500m-avg wind:       170.0 knots
    Max 150m-avg wind:       163.0 knots
    Min sea level pressure:  926.0 hPa
    Source:                  National Hurricane Center (NHC)
We can view data from one of the dropsondes by using the isel method to select a dropsonde number:
storm.recon.dropsondes.sel(location='eyewall').isel(23).data
[{'lat': 17.6, 'lon': -61.3, 'slp': 948.0, 'TOPlat': 17.61, 'TOPlon': -61.32, 'TOPtime': Timestamp('2017-09-06 03:07:00'), 'BOTTOMlat': 17.49, 'BOTTOMlon': -61.4, 'BOTTOMtime': Timestamp('2017-09-06 03:10:00'), 'MBLdir': nan, 'MBLspd': nan, 'DLMdir': 25.0, 'DLMspd': 139.0, 'WL150dir': 345.0, 'WL150spd': 133.0, 'top': 696.0, 'LSThgt': 13.0, 'software': 'AEV 33304', 'levels':       pres     hgt  temp  dwpt   wdir   wspd
0   1000.0     NaN   NaN   NaN    NaN    NaN
1    948.0     0.0  24.6  23.9    NaN    NaN
2    947.0     NaN   NaN   NaN  340.0  128.0
3    928.0     NaN   NaN   NaN  355.0  137.0
4    925.0   220.0  23.8  23.0  355.0  140.0
5    910.0     NaN   NaN   NaN  355.0  154.0
6    901.0     NaN   NaN   NaN    0.0  169.0
7    897.0     NaN   NaN   NaN    0.0  163.0
8    891.0     NaN   NaN   NaN    0.0  139.0
9    879.0     NaN   NaN   NaN   10.0  142.0
10   875.0     NaN   NaN   NaN   10.0  138.0
11   869.0     NaN   NaN   NaN   15.0  150.0
12   863.0     NaN   NaN   NaN   20.0  156.0
13   856.0     NaN   NaN   NaN   20.0  174.0
14   850.0  1960.0  20.6  19.7   20.0  179.0
15   832.0     NaN   NaN   NaN   25.0  153.0
16   812.0     NaN   NaN   NaN   30.0  163.0
17   804.0     NaN   NaN   NaN   30.0  143.0
18   756.0     NaN   NaN   NaN   40.0  124.0
19   732.0     NaN  16.4  14.1    NaN    NaN
20   700.0  2626.0  11.0   7.6   45.0  145.0
21   696.0     NaN  10.2   6.6   45.0  146.0, 'mission': '11', 'stormname': 'IRMA', 'obsnum': 21, 'mission_id': 'AF305-1111A-IRMA', 'TOPxdist': -17.607565905503332, 'TOPydist': 18.667114071950596, 'TOPdistance': 25.66101176672228, 'BOTTOMxdist': -24.822341252146206, 'BOTTOMydist': 4.665134677347142, 'BOTTOMdistance': 25.256921958065, 'location': 'EYEWALL', 'octant': 'NW'}]
Select one of the eyewall dropsondes and plot the Skew-T:
storm.recon.dropsondes.sel(location='eyewall').isel(23).plot_skewt()
<Figure size 1700x1100 with 4 Axes>
Plot a map of dropsonde points colored by 850mb temperature:
storm.recon.dropsondes.plot_points('temp',level=850,prop={'cmap':{1:'dodgerblue',2:'gold',3:'firebrick'},'ms':20})
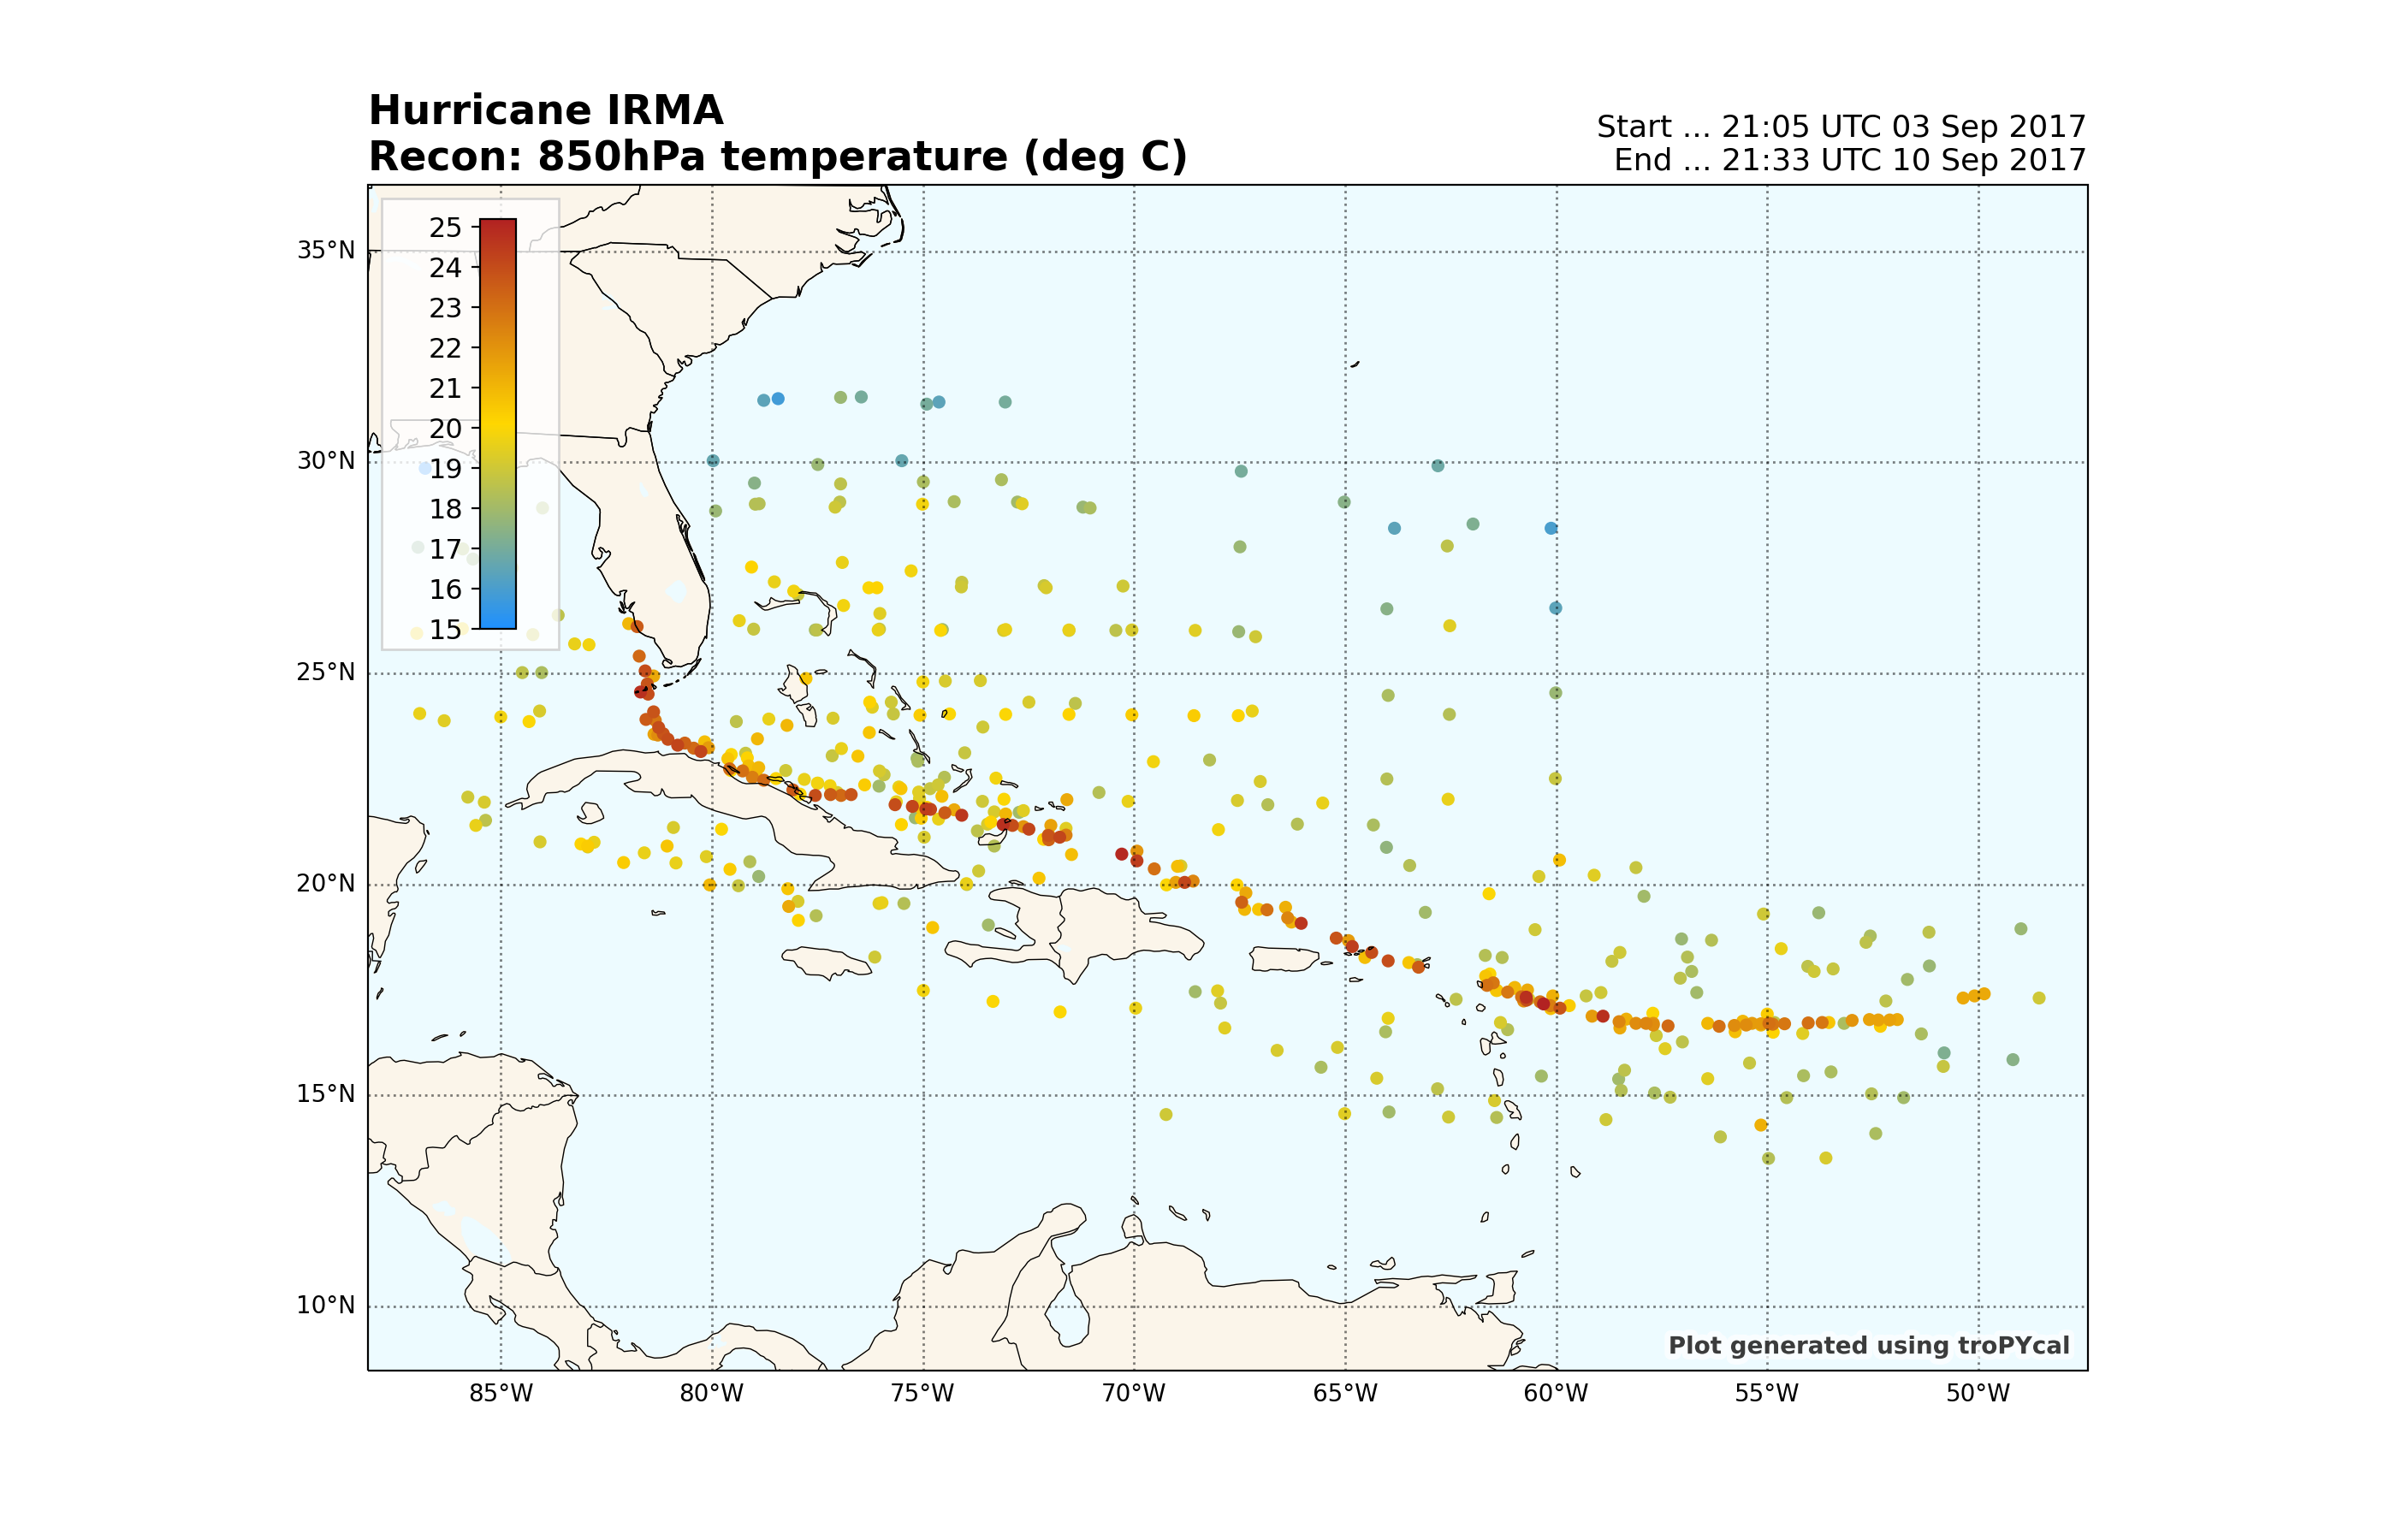
<GeoAxes: title={'left': 'Hurricane IRMA\nRecon: 850hPa temperature (deg C)', 'right': 'Start ... 21:05 UTC 03 Sep 2017\nEnd ... 21:33 UTC 10 Sep 2017'}>
Plot a map of only upper-air dropsondes released at 300mb and above, colored by wind speed at 300mb:
storm.recon.dropsondes.sel(top=(None,300)).plot_points('wspd',level=300,prop={'cmap':{1:'dodgerblue',2:'gold',3:'firebrick'},'ms':20})
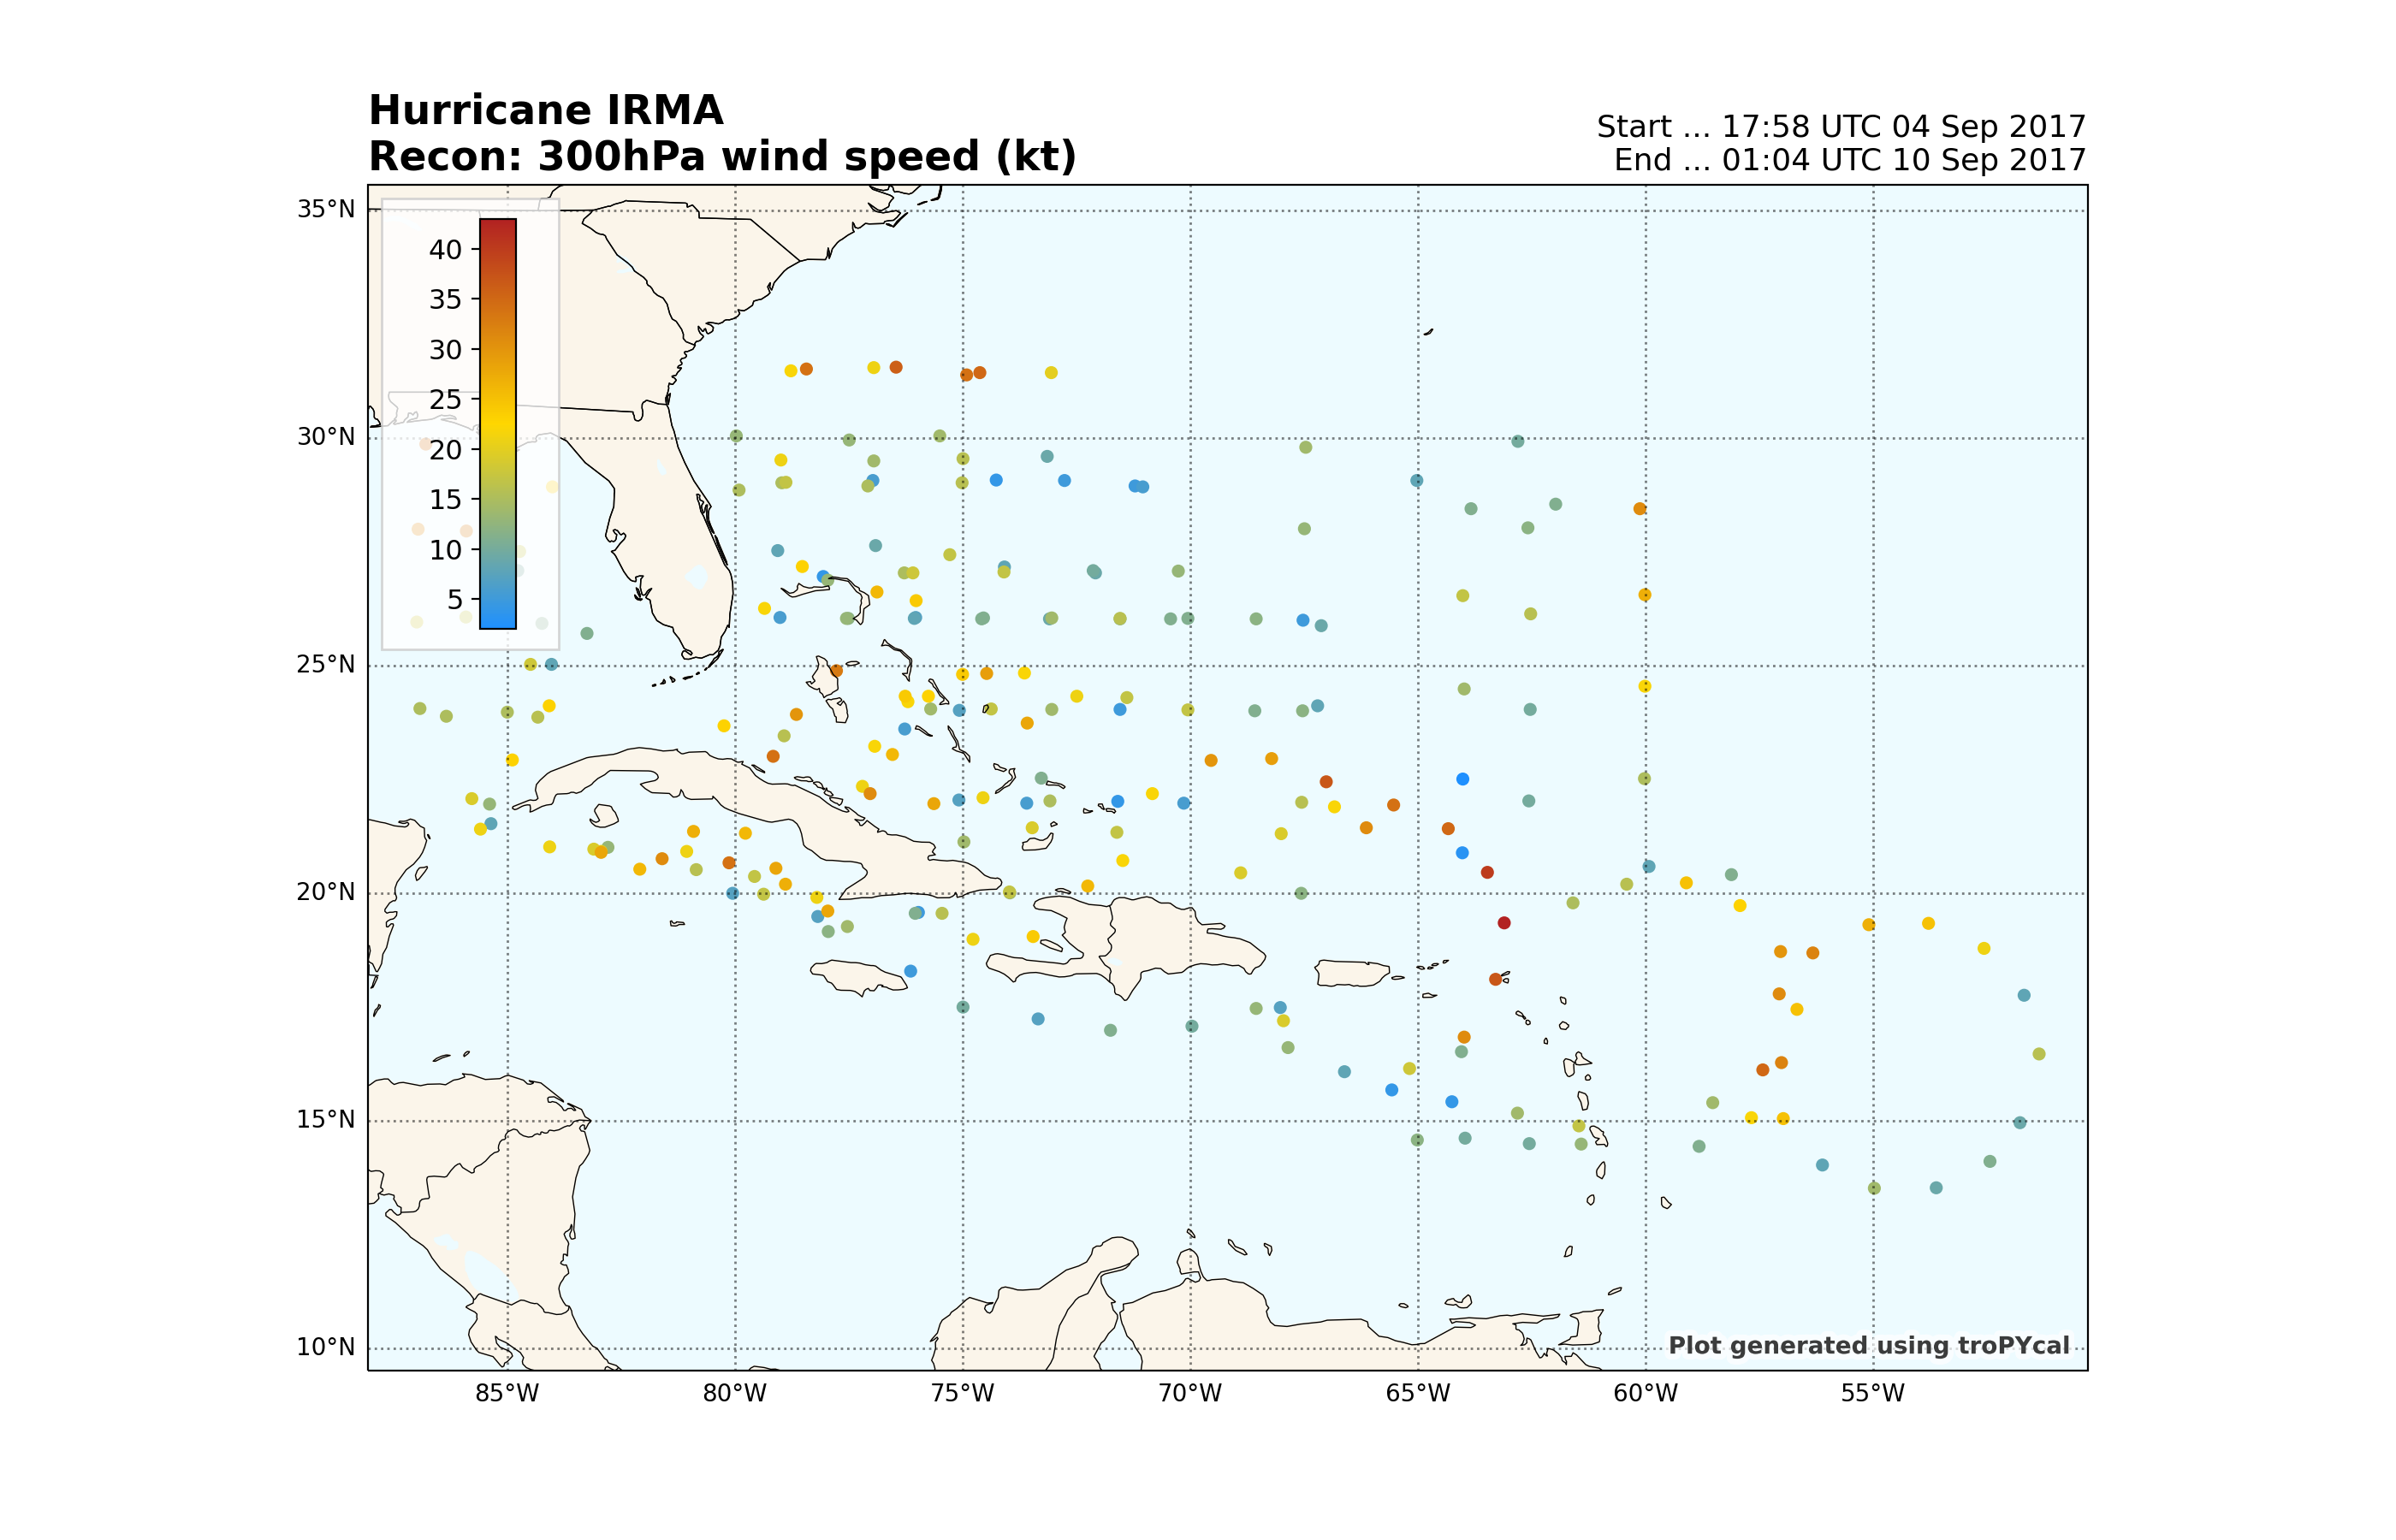
<GeoAxes: title={'left': 'Hurricane IRMA\nRecon: 300hPa wind speed (kt)', 'right': 'Start ... 17:58 UTC 04 Sep 2017\nEnd ... 01:04 UTC 10 Sep 2017'}>
Vortex Data Messages (VDMs)
The last class we’ll look at is the VDM class. Let’s start off by viewing a summary of VDM data for Hurricane Irma:
<tropycal.recon.vdms>
Dataset Summary:
    Storm:                   IRMA 2017
    Missions:                23
    VDMs:                    82
    Min sea level pressure:  915.0 hPa
    Source:                  National Hurricane Center (NHC)
Let’s look at decoded VDMs for a specific pass:
storm.recon.vdms.isel(10).data
[{'time': datetime.datetime(2017, 9, 4, 23, 7, 5), 'lat': 16.68, 'lon': -54.87, 'Standard Level (hPa)': nan, 'Minimum Height at Standard Level (m)': nan, 'Estimated Maximum Surface Wind Inbound (kt)': 97.0, 'Dropsonde Surface Wind Speed at Center (kt)': 13.0, 'Dropsonde Surface Wind Direction at Center (deg)': 263.0, 'Maximum Flight Level Wind Inbound': '353 deg 110 kt', 'Location of the Maximum Flight Level Wind Inbound': '264 deg 15 nm', 'Minimum Sea Level Pressure (hPa)': 945.0, 'Maximum Flight Level Temp Outside Eye (C)': 13.0, 'Maximum Flight Level Temp Inside Eye (C)': 19.0, 'Dew Point Inside Eye (C)': 18.0, 'Eye character': 'closed', 'Eye Shape': 'circular', 'Eye Diameter (nmi)': 25.0, 'Aircraft': 'NOAA2', 'mission': '05', 'Remarks': ' MAX FL WIND 130 KT 001 / 22 NM 21:45:54Z MAX FL TEMP 19 C 108 / 6 NM FROM FL CNTR CNTR DROPSONDE SFC WIND 130 / 06 KTS ', 'mission_id': 'NOAA2-0511A-IRMA'}]
Plot a map of VDM center location, colored by minimum pressure (default):
storm.recon.vdms.plot_points(prop={'cmap':{3:'dodgerblue',2:'gold',1:'firebrick'},'ms':40})
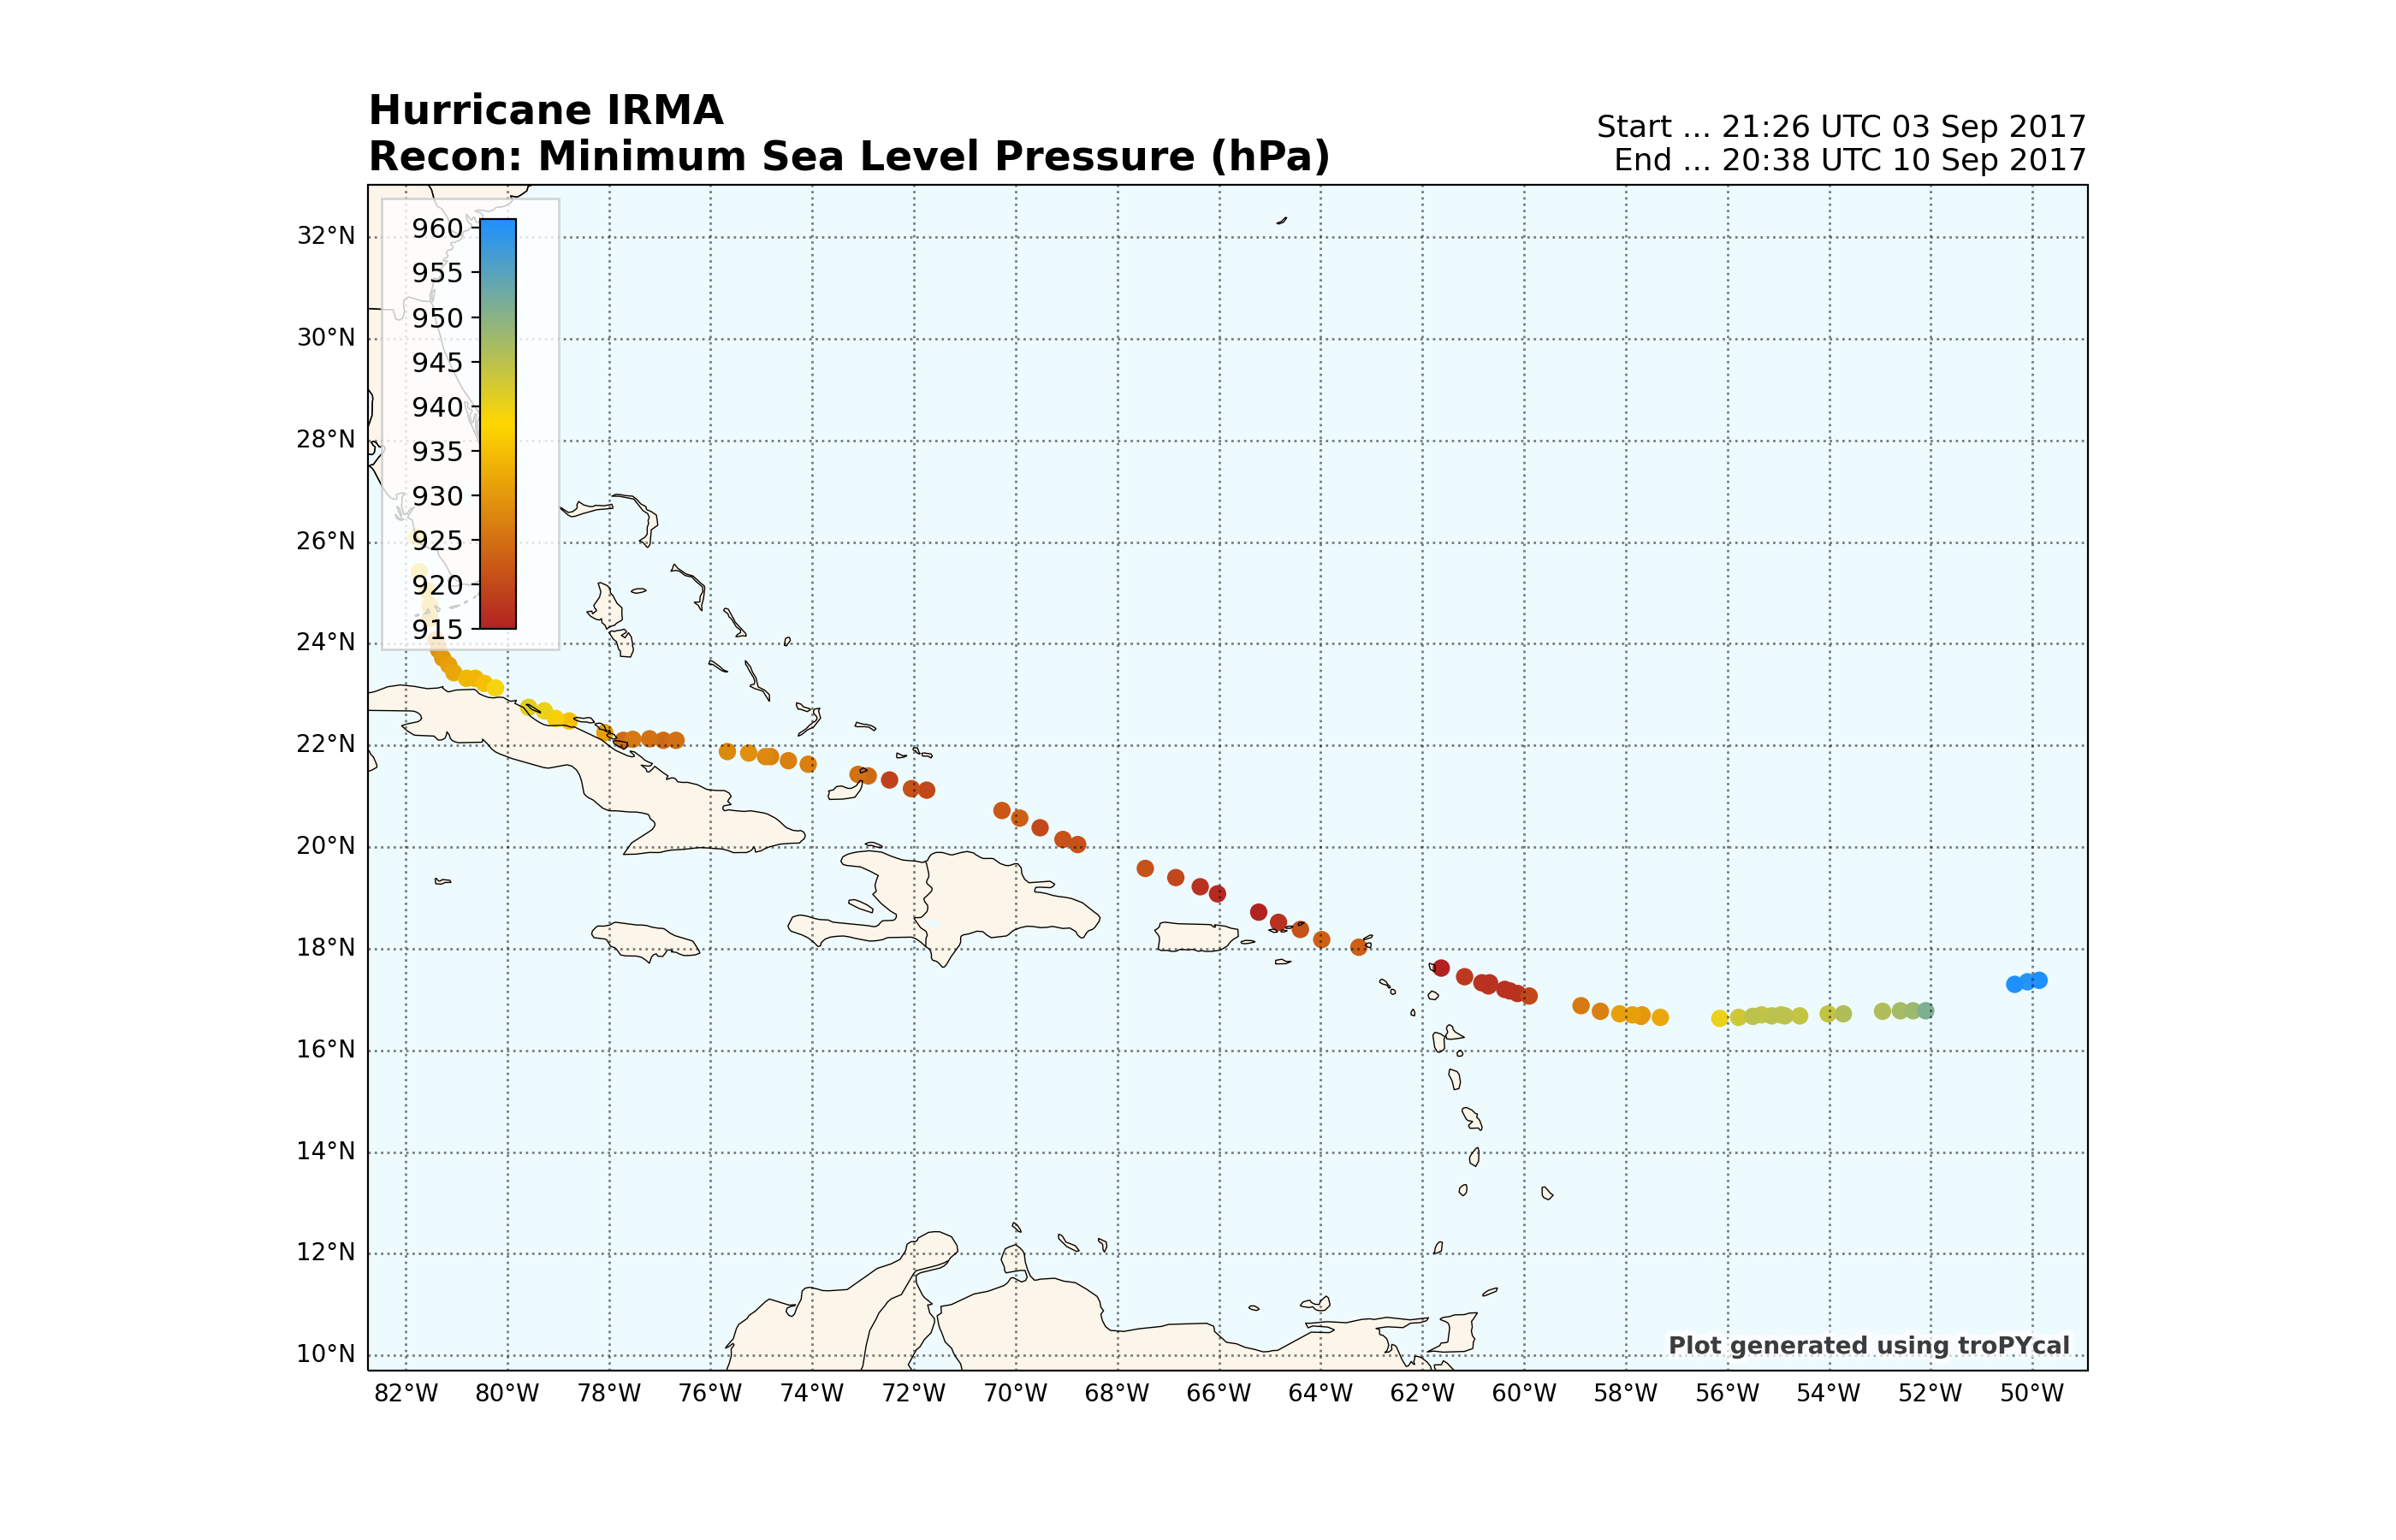
<GeoAxes: title={'left': 'Hurricane IRMA\nRecon: Minimum Sea Level Pressure (hPa)', 'right': 'Start ... 21:26 UTC 03 Sep 2017\nEnd ... 20:38 UTC 10 Sep 2017'}>
Total running time of the script: ( 8 minutes 37.605 seconds)